

April 2024
Equities eclipsing all-time highs.

In this month’s update, we discuss the positive but trailing performance of American equities and the potential resurgence of inflation.
March in Review
The rally persisted through March, the Ides ignored. For American equities, the Russell 2000 led with a +3.39% gain, followed by the S&P 500 at +3.1%, the Dow Jones Industrial Average at +2.08%, and the Nasdaq Composite lagged the pack at +1.79%. Globally, Spain surged to the top with a +10.73% gain, Germany rose by 4.61%, Britain rose by 4.23% (highlighted last month), and similarly the Euro Stoxx 50 gained +4.22%. In Asian markets, Japan continued its rally on the Nikkei 225 with +3.07%, while China showed a more modest increase with the SSE Composite ticking up by +0.86%.
The U.S. 10-year government bond rate decreased by -0.046 points to 4.206%. The Federal Funds rate remained unchanged for the seventh consecutive month. The VIX contracted further, decreasing by -0.39 points.
As a potential signal of rekindling inflation, the Goldman Sachs Commodities Index rose by +4.40%, a reversal from our previous forecast. Gold had an outstanding month, increasing by +9.27%. Silver outshone its big brother, gaining +10.21%. The digital equivalent of the yellow rock, Bitcoin, also outperformed at +14.06%. Bitcoin surpassed its all-time high, reaching $73,794.
Equity Flows
Flows were even more positive than in February. NVDA remained the most active stock, rising by +13.83% with $1.098T in flows.
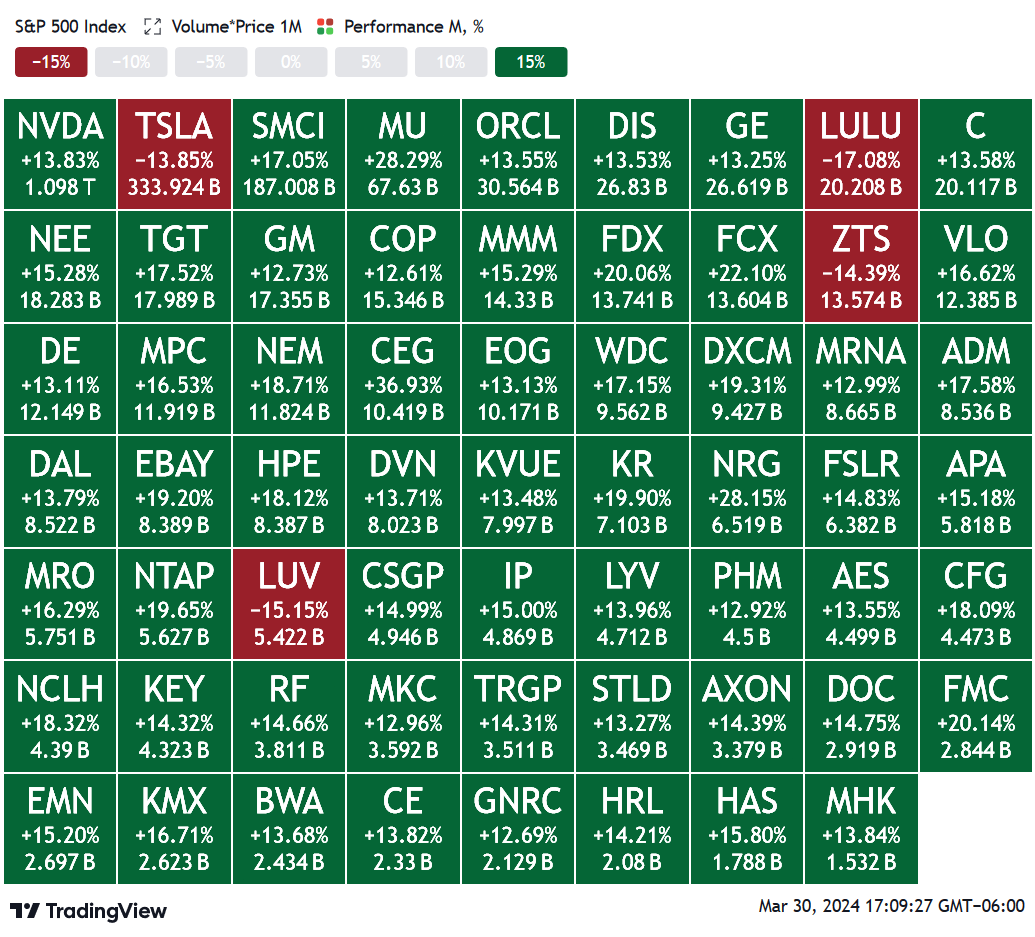
Using this heatmap made me skeptical this month. Note how it shows CEG with a +36.93% increase? Upon closer examination, the actual gain for the stock in March was only +9.95%. I’ll need to rely on for more reliable data sources in the future.
NVDA Inflection?
In line with yesterday’s weekly article, let’s draw a potential ceiling trendline for NVDA:
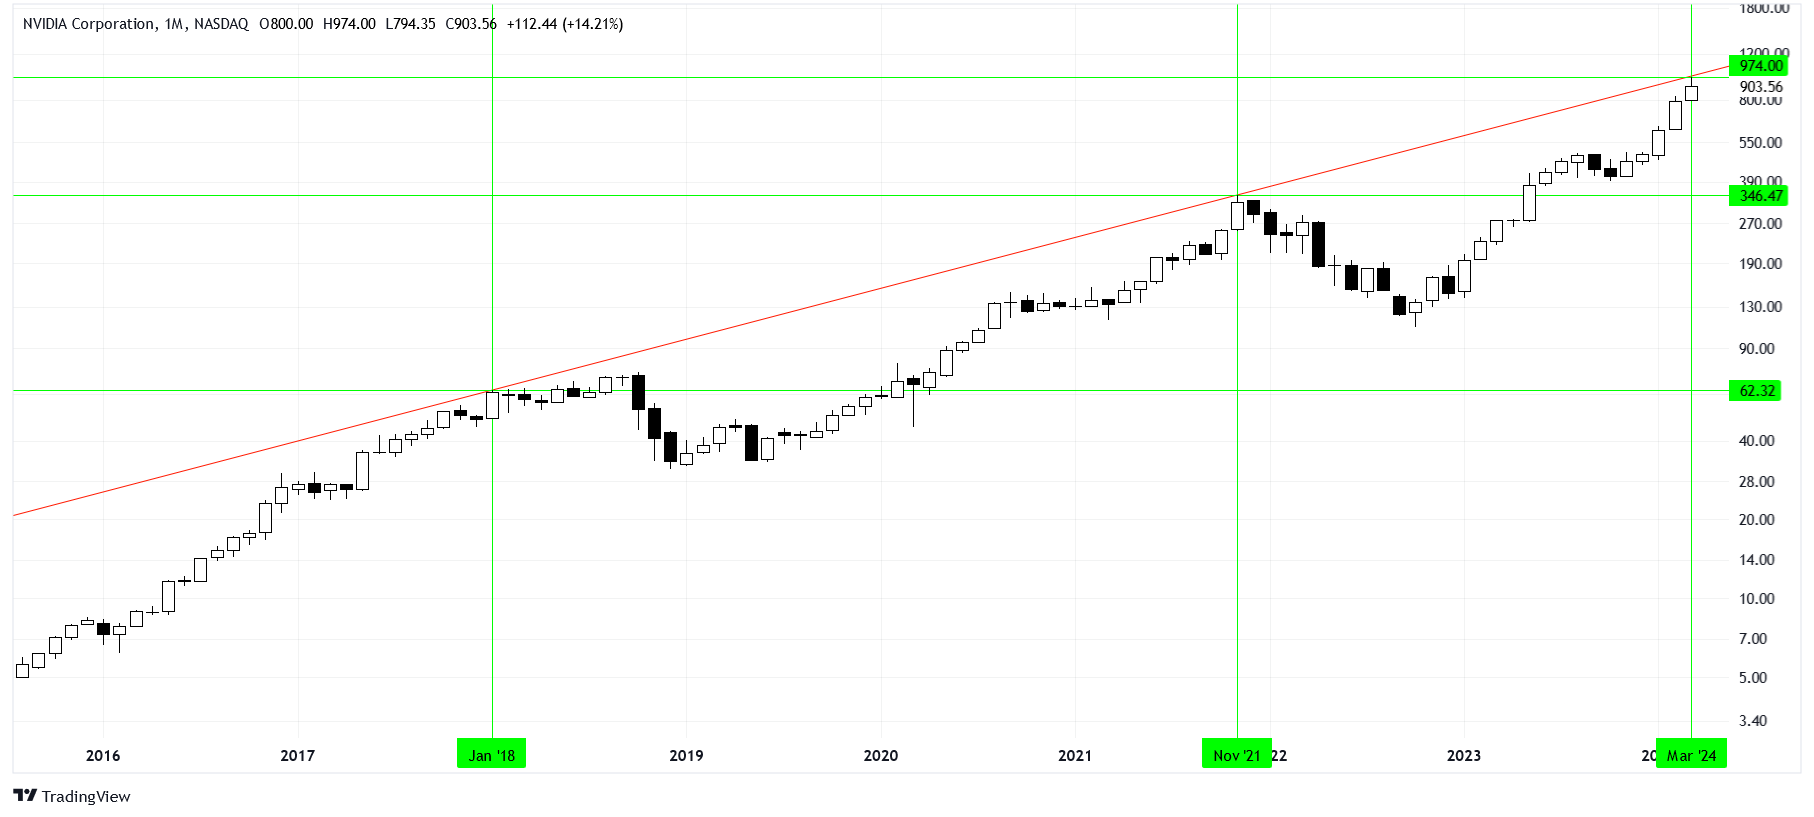
It’s important to note that this line is not foolproof and can be broken. Nevertheless, as long as the market acknowledges and respects this line, it holds significance. This seems to be the case based on last month’s price action.
The line suggested $984 as a possible high for March, but the actual high was $974, followed by a decline down to $903. Importantly, the big number of $1000 is within reach for next month! Keep an eye on this level.
Disclaimer
The content provided is for informational and educational purposes. It is not financial advice. You are solely responsible for your investment decisions. The author assumes no liability for losses or damages resulting from decisions based on the content provided.