

August 2024
Ave... the other Caesar!

In this month’s market review, we look at the Wilshire 5000… but is it worth it?
Erratum
I made a mistake last month by posting an image of Augustus for July. In order to maintain balance in my errors, I am posting an image of Julius for August!
July in Review
Let’s get right to it.
Volatility is back… sort of.
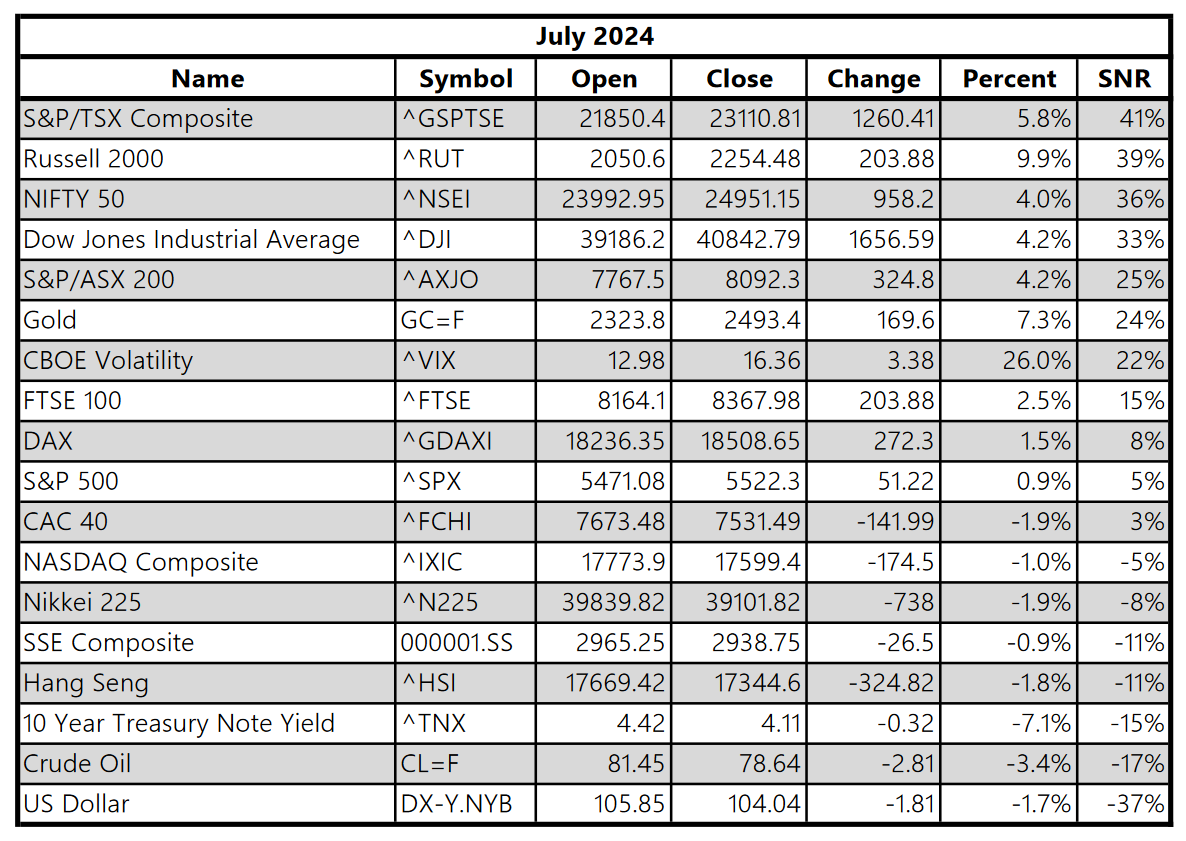
The CBOE Volatility index (VIX) increased from 12.98 to 16.36 in July, marking the largest upswing since April. In the beginning of July, the VIX was so muted that it got below 12 in a few instances. Historically, this is not an extremely low level (it’s something like the 11th percentile), but it’s the lowest since January 2020.
And it’s not like 17 is very high either. For context, 2008 and 2020 saw the absolutely astronomical level of 75 on the VIX. I’m not trying to claim that we have to see something that ridiculous before we start making moves, rather that the VIX is not doing anything out of the ordinary currently.
The most definitive moves to the upside were seen in the TSX (Canadian equities), the Russell 2000, and the NIFTY 50 (Indian equities). Out of these, the Russell saw the best nominal performance, a +9.9% move to the upside.
Something that didn’t move much? The S&P 500 index.
The most definitive moves to the downside were seen in the U.S. dollar, crude oil, and the 10-year Treasury note yield. Of these, the 10-year Treasury note yield moved the most, dropping -0.32 points in its level.
Ever since October 2023 when the 10-year Treasury note yield kissed 5%, we’ve dealt with a really massive level just above. It appears that April 2024 denotes another local peak where the yield reached close to 4.7%.
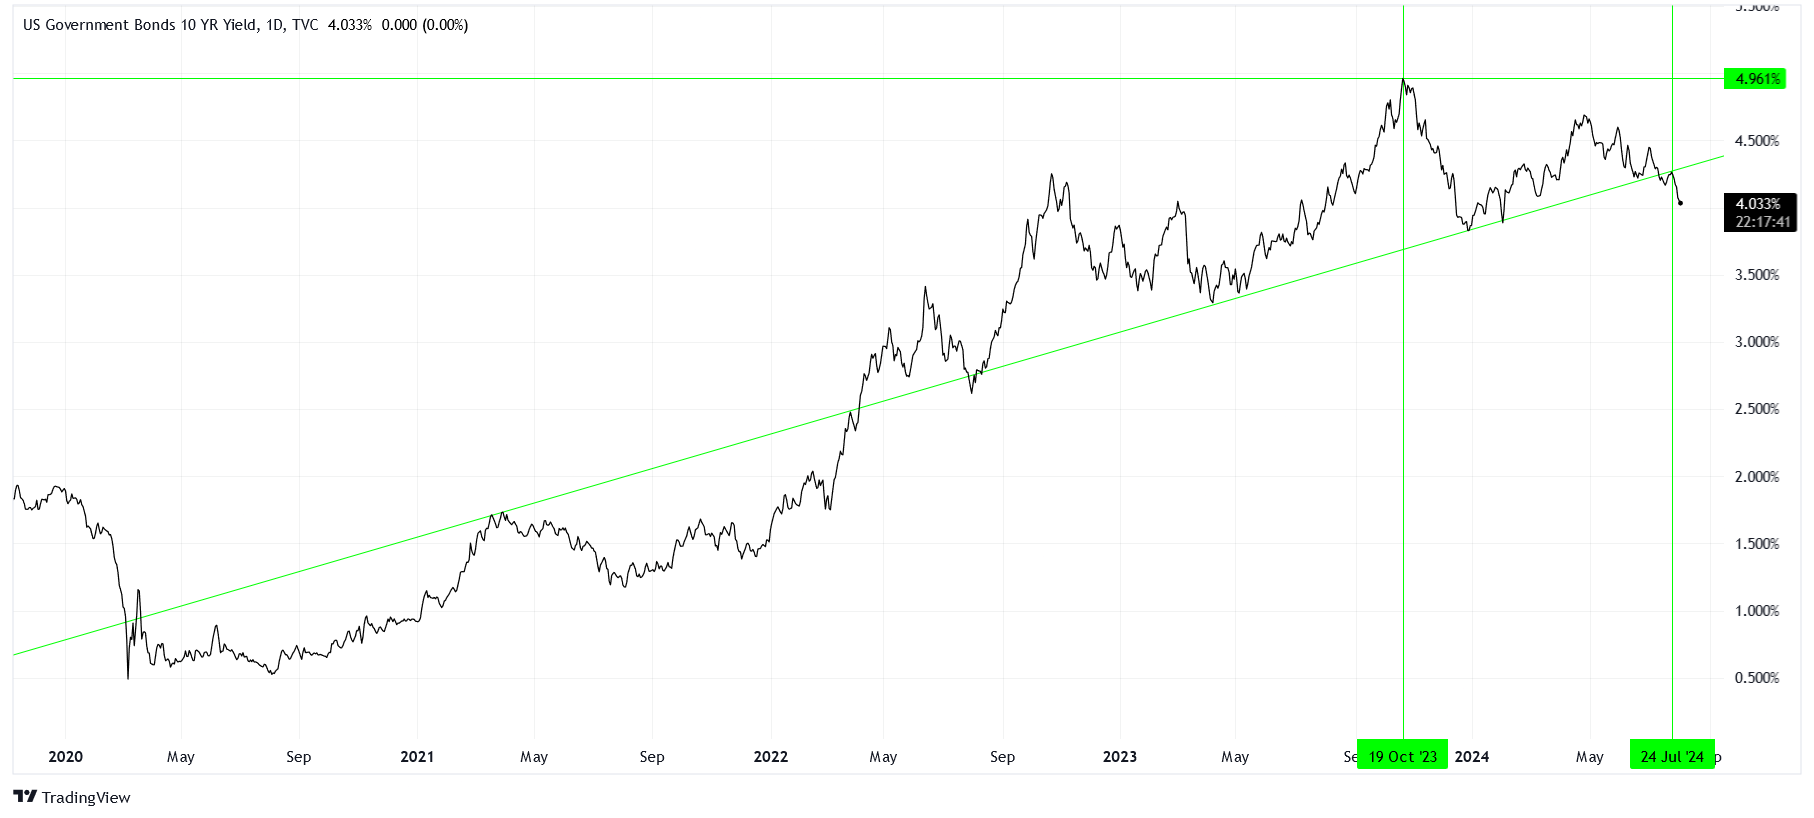
Will this past month mark a break in the rising trend since April 2022? Time will tell.
One thing is for sure, watch this yield like a hawk in the coming weeks. If the market senses that yields will decline, that we’re due to for rate cut, then some equity investors will seriously consider switching to bonds. Stating the obvious, but owning equities is more difficult when money is flowing out of them.
A Wider Net
In keeping with the theme of increasing our universe of stocks from the Nasdaq-100 in May to the S&P 500 in June, we will take a look at the components of the Wilshire 5000 for July. This is likely the end of the line for the size of our universe.
While its name suggests there are 5000 components, Wikipedia claims that there are actually 3403 components. What I was able to scrape, however, is a total of 2566 components. Hopefully this is enough, because it’s almost a gigabyte of data!
Goodie Bag
Now, because our universe is so large, the quality of the highlights might suffer. Let me show you what I mean.
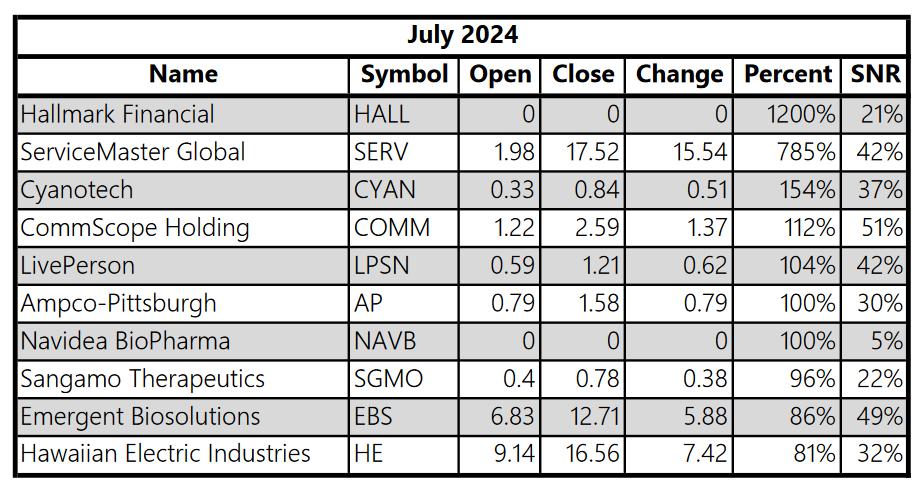
While I’m excited to see a company like Hawaiian Electric (HE) show up on this list, mostly because me and my market buddies were all curious about it in October 2023, unfortunately the majority of stocks listed here are unrecognizable. Not only unrecognizable, but penny stocks!
If you like to trade penny stocks, more power to you. Personally, even though I am quite tolerant of risk (just go check out the path for HE since last October), penny stocks are iffy territory in my book. Unless you have really good information about the company’s operations, the market isn’t too excited about these companies. Of course, these stocks are showing up in the high flyers list, so if you like to gamble you can sometimes win big with these types of investments.
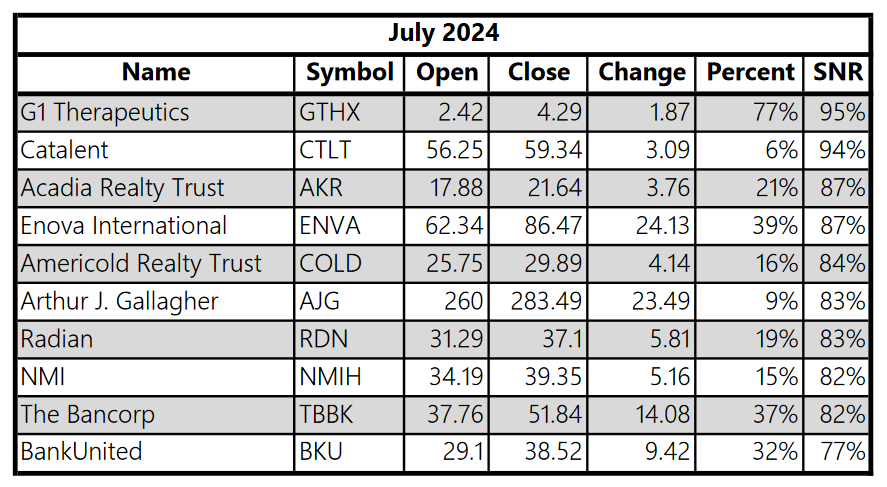
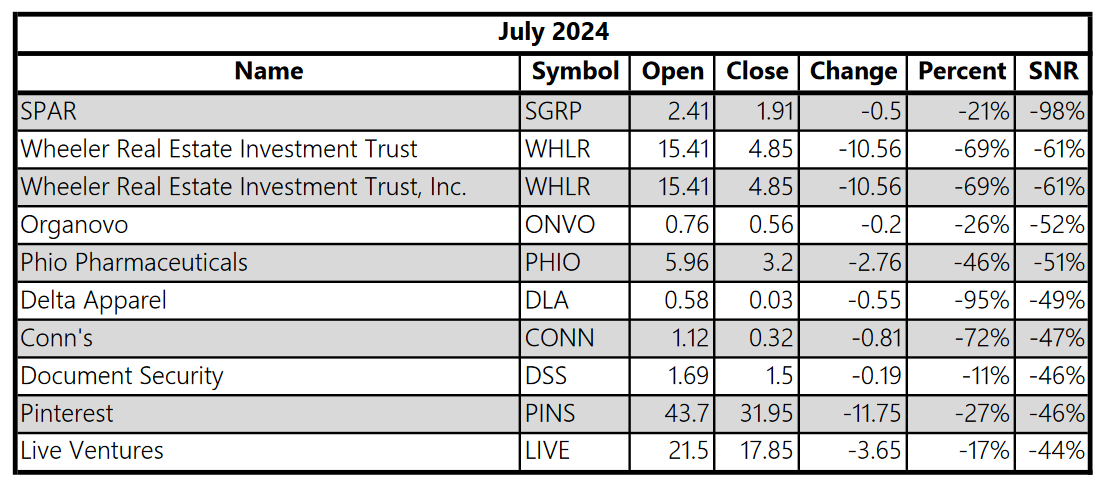
If we look at SNR instead of percent returns, we can get a sense of the definitive moves to the upside (I’ve been referring to SNRs with large magnitudes as “definitive” in this article).
These are the smoothest rides. Not always the most explosive, but the smoothest. Funny enough, Catalent (CTLT) shows up on this list and is a stock that I was looking at back in May 2023. Looks like I could have made a pretty penny into September 2023, but alas I did not keep tabs on this one.
Notice there are no penny stocks in this list. Interesting.
Lumps of Coal
A favorite pastime of mine, looking at train wrecks.
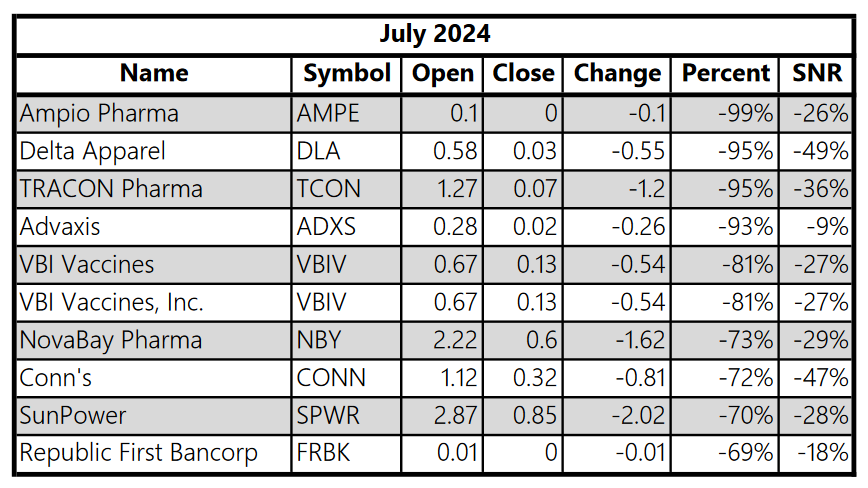
Notice a trend in the above and the table of high flyers? It appears that pharmaceutical and biotechnology companies are very high beta. Some of them are doing wonderfully, some of them are going out of business. Financial and holding companies too. I wonder if that’s just a fluke this month or a real pattern.
For the definitive moves to the downside, Pinterest (PINS) is a recognizable name, but the others not so much.
Tinkering
Overall, I am sort of disappointed with the lower quality tables this month.
It’s apparent that I have to arrive at some sort of filtering or grouping method to look at different parts of the market. Market capitalization, brand recognizability, perhaps even the lifetime alpha and beta of the stock – there are plenty of ways to slice and dice our universe going forward.
I’ll let you know come September.
Disclaimer
The content provided is for informational and educational purposes. It is not financial advice. You are solely responsible for your investment decisions. The author assumes no liability for losses or damages resulting from decisions based on the content provided.