

AUM Spreads
Or: how I learned to avoid crowded trades.

In today’s article, we discuss an indicator that allows us to investigate ETF positioning.
Exchange-Traded Fund (ETF)
An Exchange-Traded Fund (ETF) is a type of pooled investment security that trades similar to a stock. You can think of it akin to a mutual fund. Many ETFs are thematic or specific to some market component.
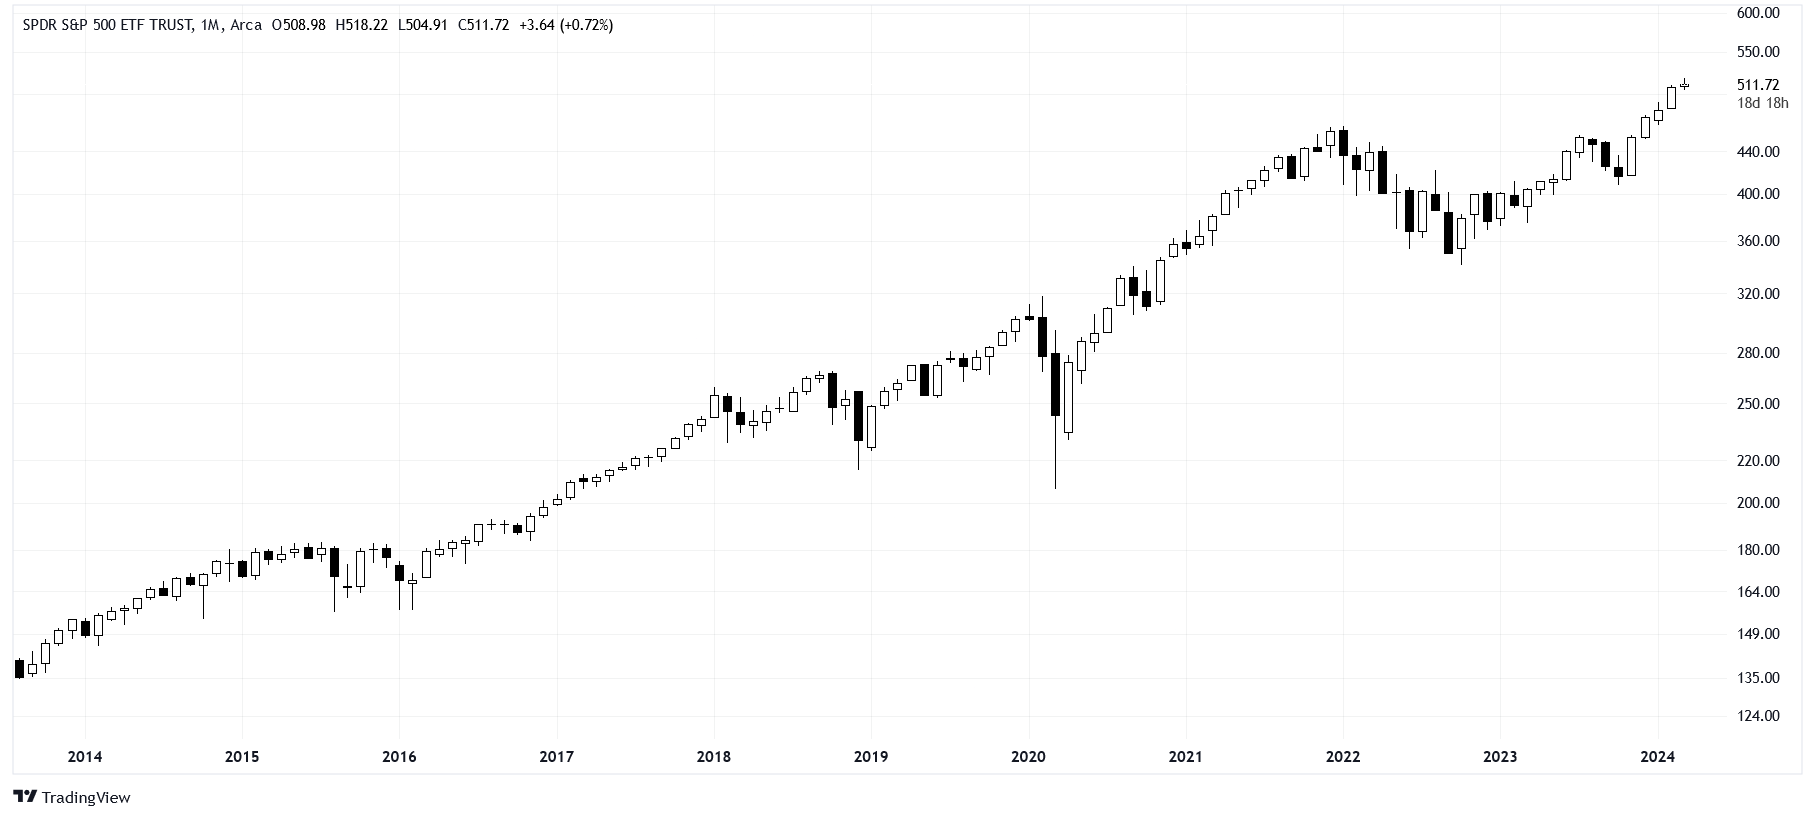
The first ETF was the SPY, which tracks the S&P 500 index and remains the most popular. ETFs have management fees attached, so it is wise to minimize the fees when comparing similar ETFs. For instance, the IVV and VOO also track the S&P 500 index but with lower fees.
A good place to find ETFs is the ETF Database.
Assets Under Management (AUM)
The best way to judge the size of an ETF is by looking at the assets under management (AUM).
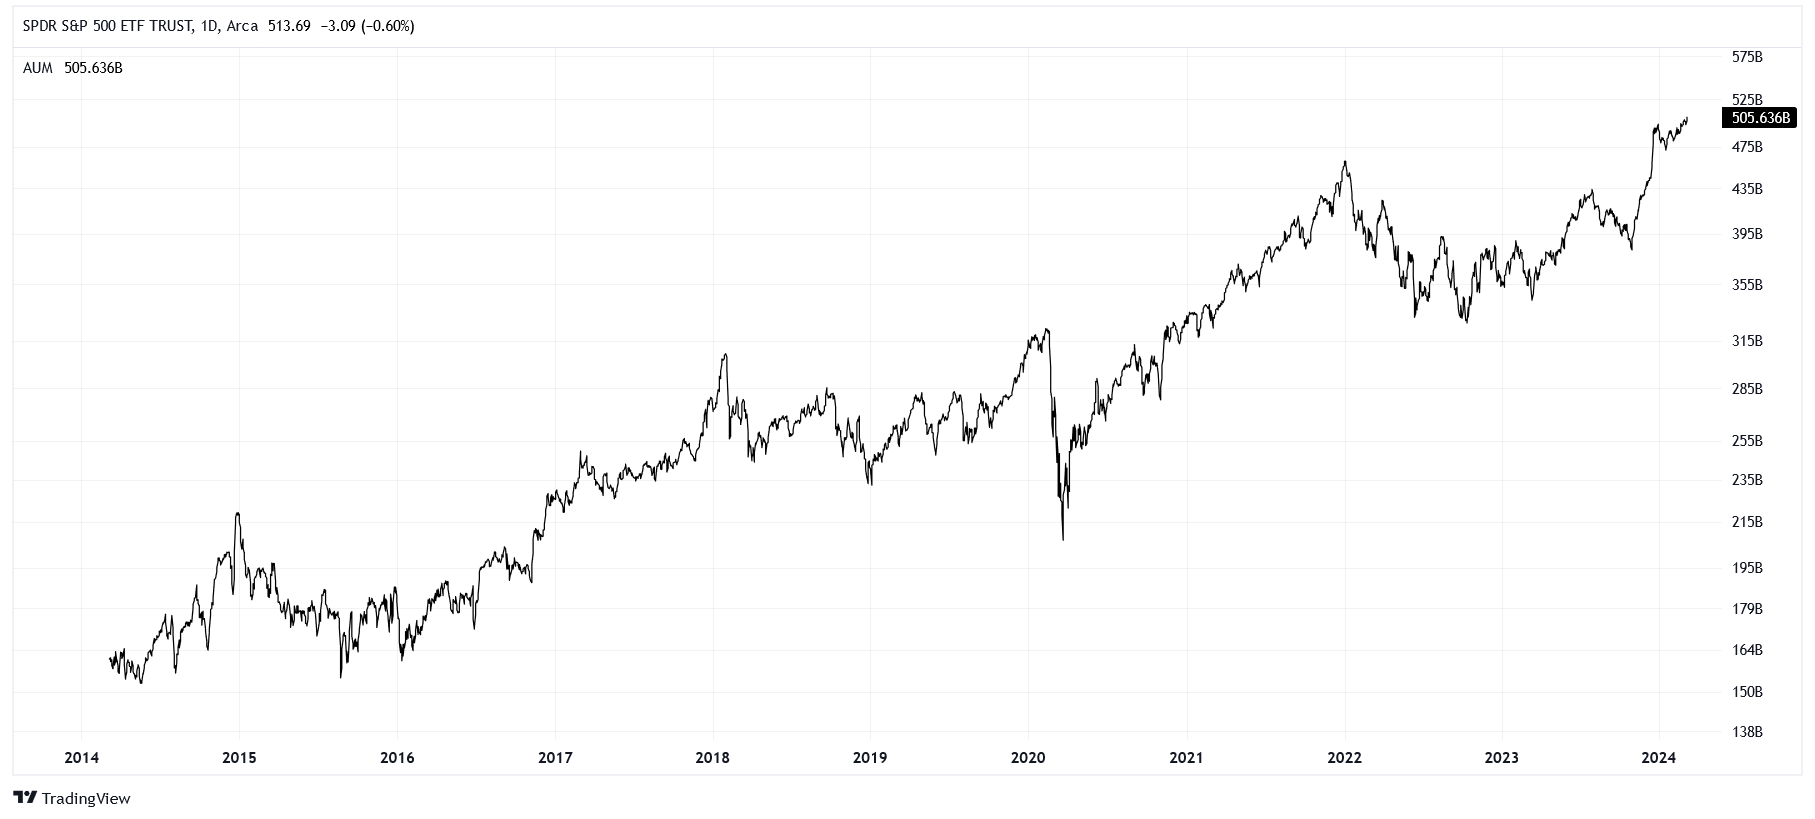
When money flows into an ETF, it starts to appreciate in value if the net asset value (NAV) increases. This concept is akin to investing $10 in a stock, seeing its price increase, and now your initial $10 investment is valued at, say, $15. A $10 flow appreciated to $15 AUM due to a NAV return of +50%.
Why is AUM worth looking at? While analyzing AUM on a single ETF has its limitations, it becomes much more insightful when we incorporate multiple ETFs.
Speculation Seesaw
If you enjoy speculative investments, there are a pair of ETFs you may find interesting. The TQQQ is the 3x bullish QQQ fund, and the SQQQ is the 3x bearish QQQ fund. Both of these ETFs have high fees due to their leverage, making them unsuitable for long-term holds.
When we calculate the ratio between the bullish AUM and the bearish AUM, we obtain something akin to a positioning indicator.
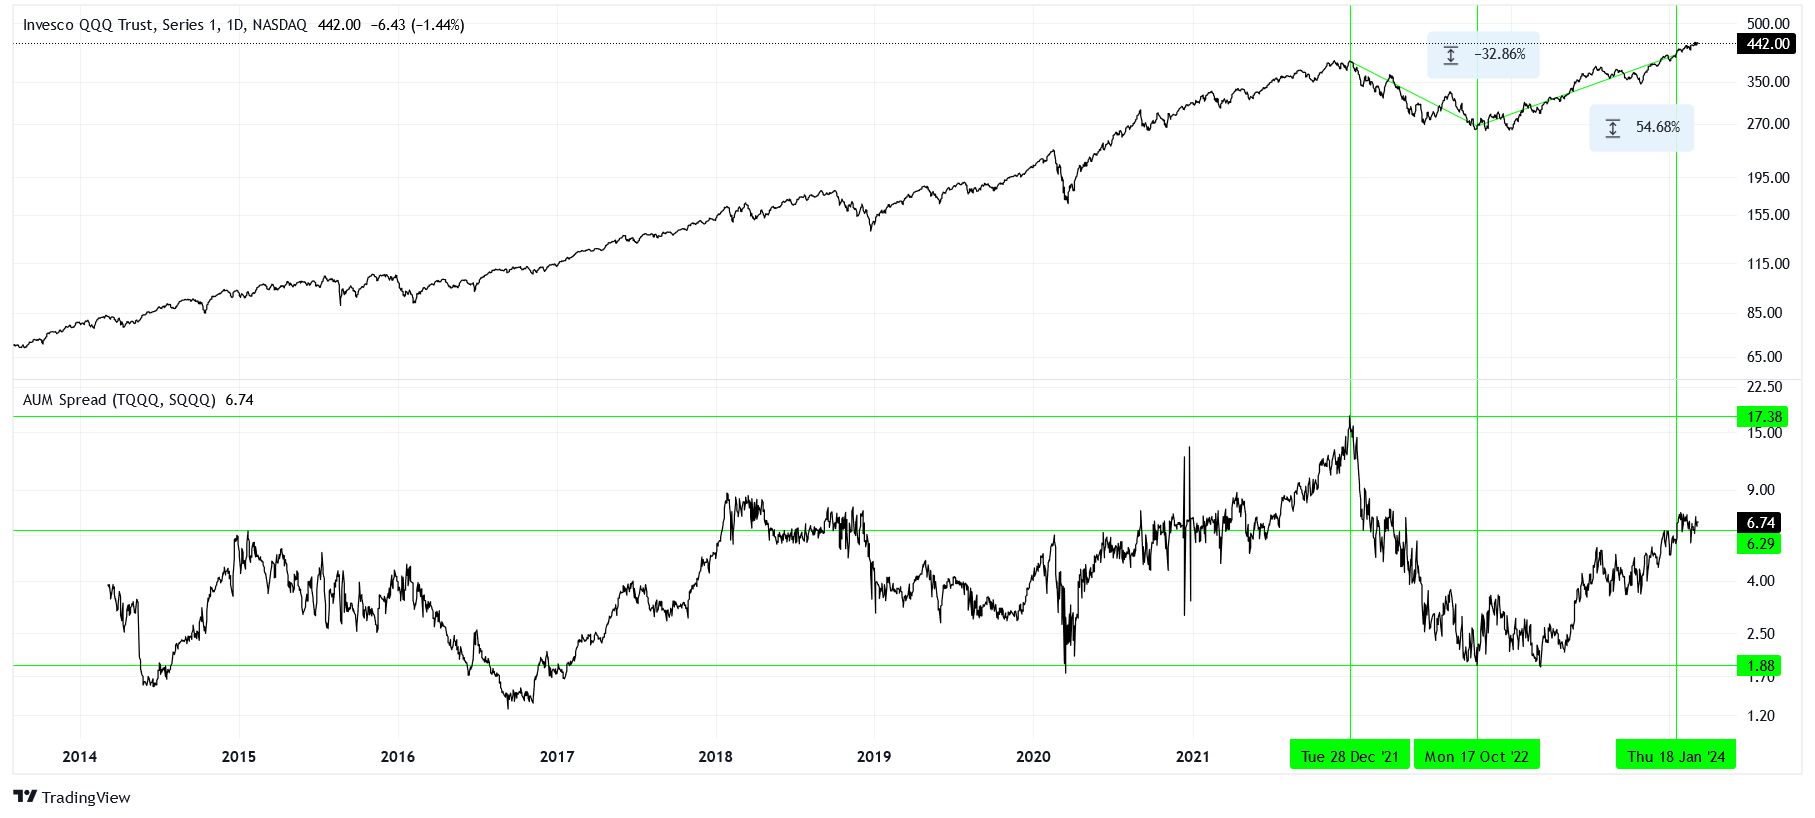
Let us examine the past three years as an example. From the end of 2021 to October 2022, the QQQ declined by approximately -33%. In the same period, our ratio shifted from 17.4 to 1.9. This means that in December 2021, there was 17.4 times more money in the TQQQ than the SQQQ, but by October 2022, this ratio had decreased significantly to 1.9. This represents a substantial swing in the ratio. From October 2022 to today, the QQQ has risen by about +55%, and our AUM ratio has settled at a stable yet elevated level of 6.7.
What makes the AUM spread more powerful than analyzing the AUM of one ETF? Notice that this ratio often returns to similar levels when we see bearish and bullish sentiment, making it easier to analyze than price. More importantly, positioning drives price. When enough money is crowded bearish or bullish, price has plenty of “fuel to burn” in the other direction, so to speak. Trap enough bears in a short and you can squeeze them out!
Market Safari
If all you have is a hammer, everything looks like a nail.
In our final section, let’s explore a variety of AUM spreads.
The first chart illustrates the concentrated nature of our market: the SPY/QQQ pair. Notice we are looking at the price spread in addition to the AUM spread of this pair.
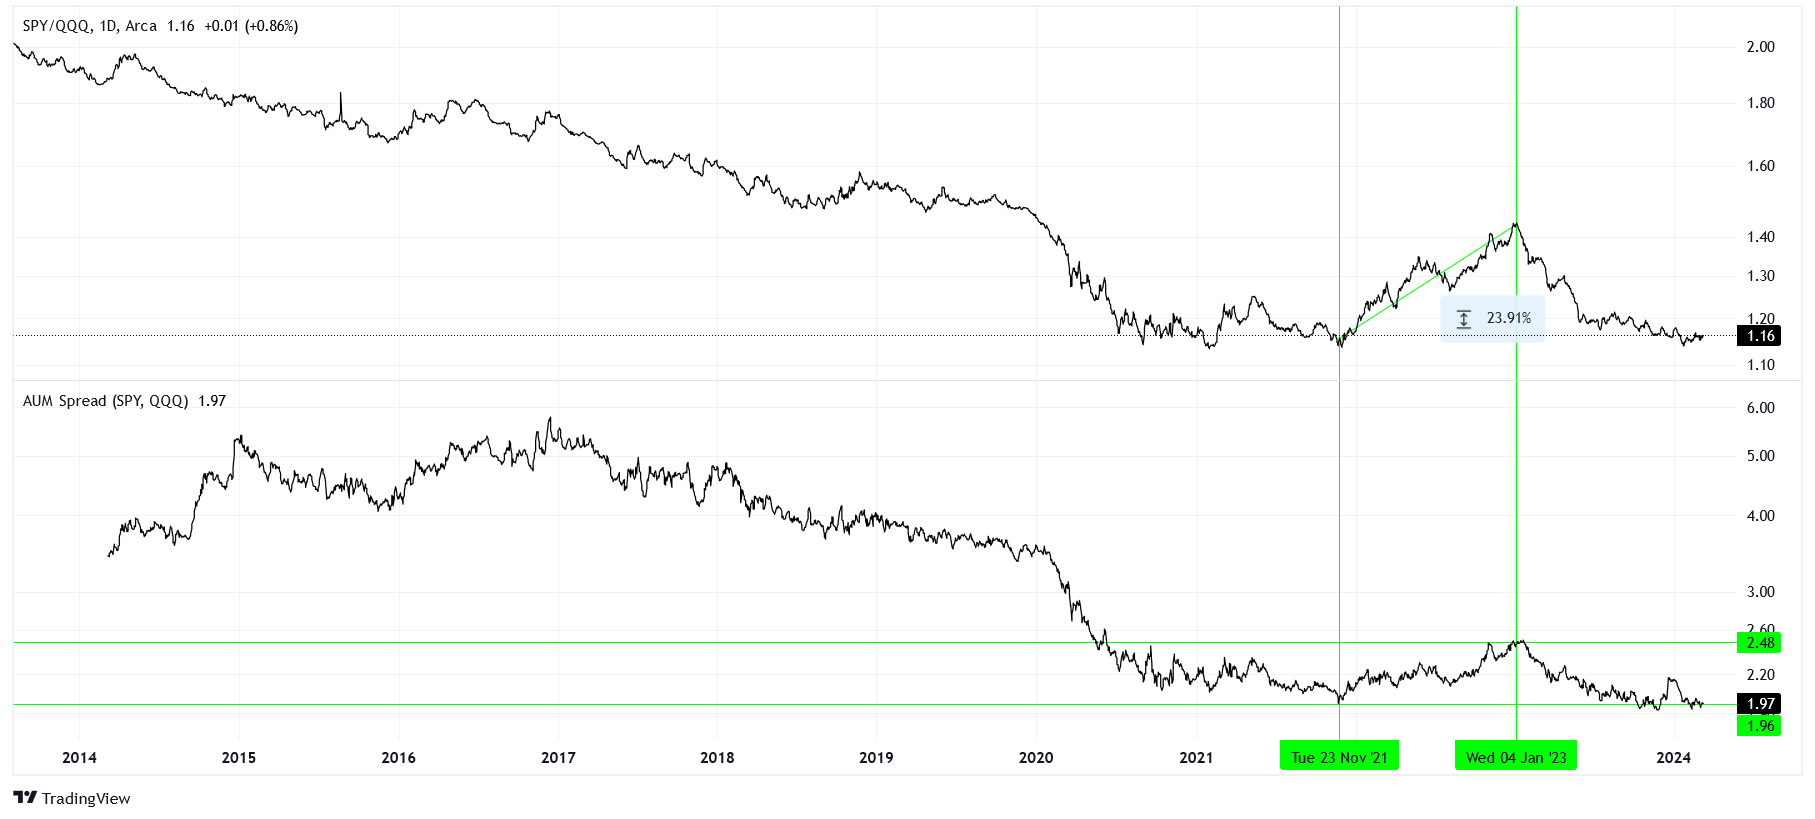
The SPY has under-performed the QQQ as the U.S. equity market has become increasingly concentrated. If there is a significant concentration of money in mega-cap stocks, it may be worth considering investing in an equal-weighted index instead.
Next, let’s consider an alternative asset to equities: SPY/GLD (gold fund).
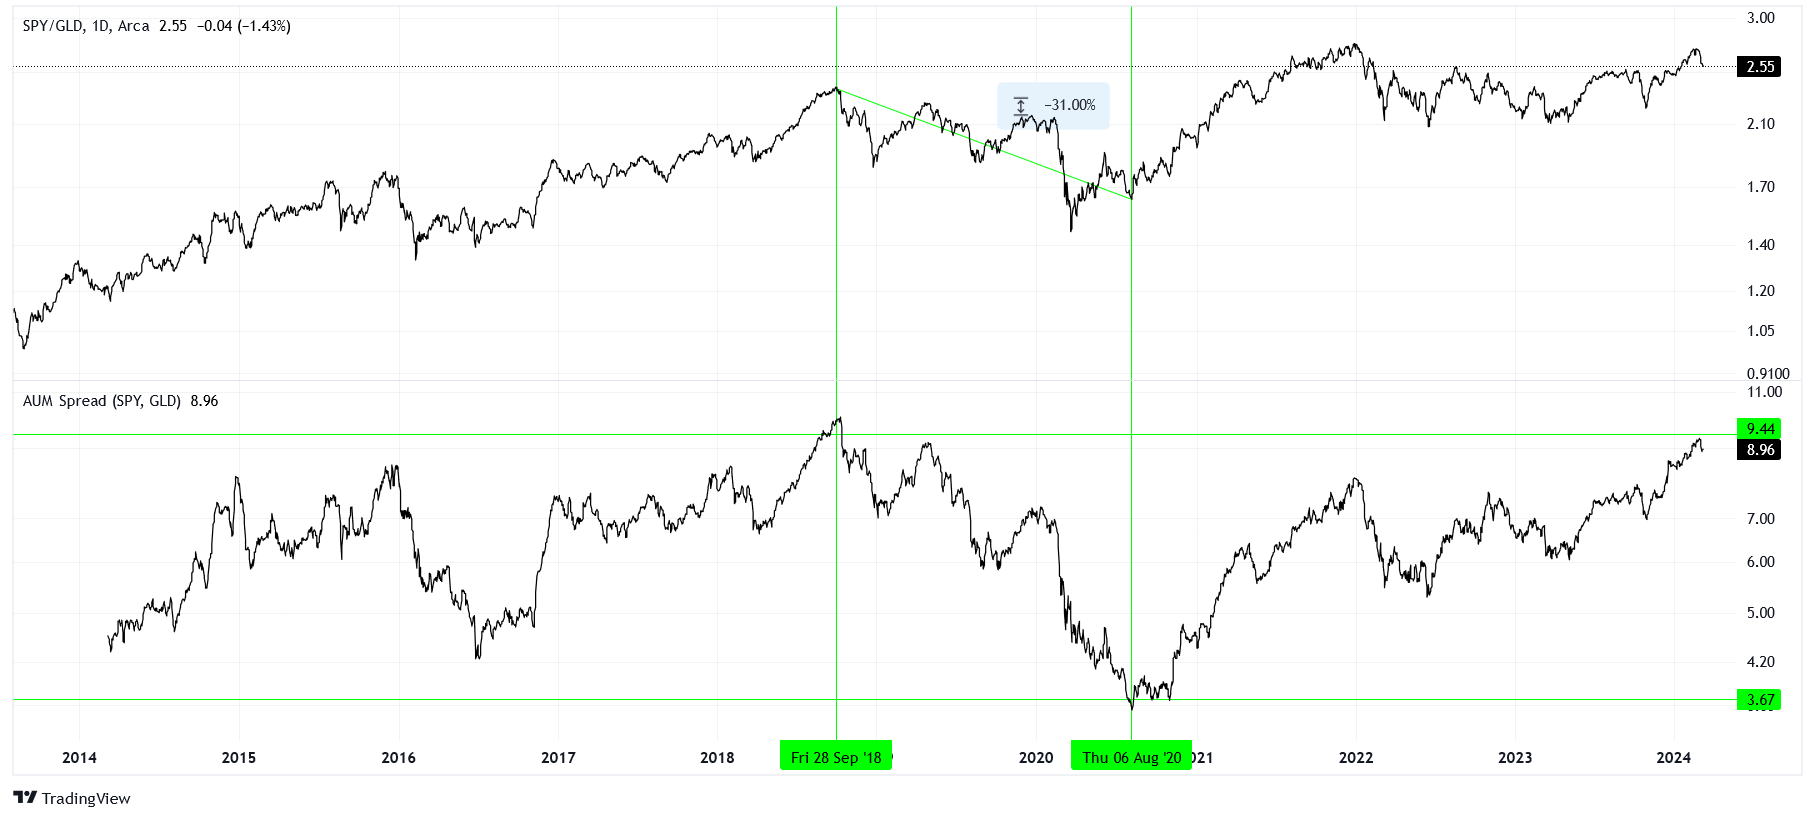
The last time the AUM ratio of SPY/GLD was this elevated (indicating a crowding into equities), equities under-performed gold by -31% in the following years.
We see a similar crowding in equities over the dollar, represented by SPY/UUP.
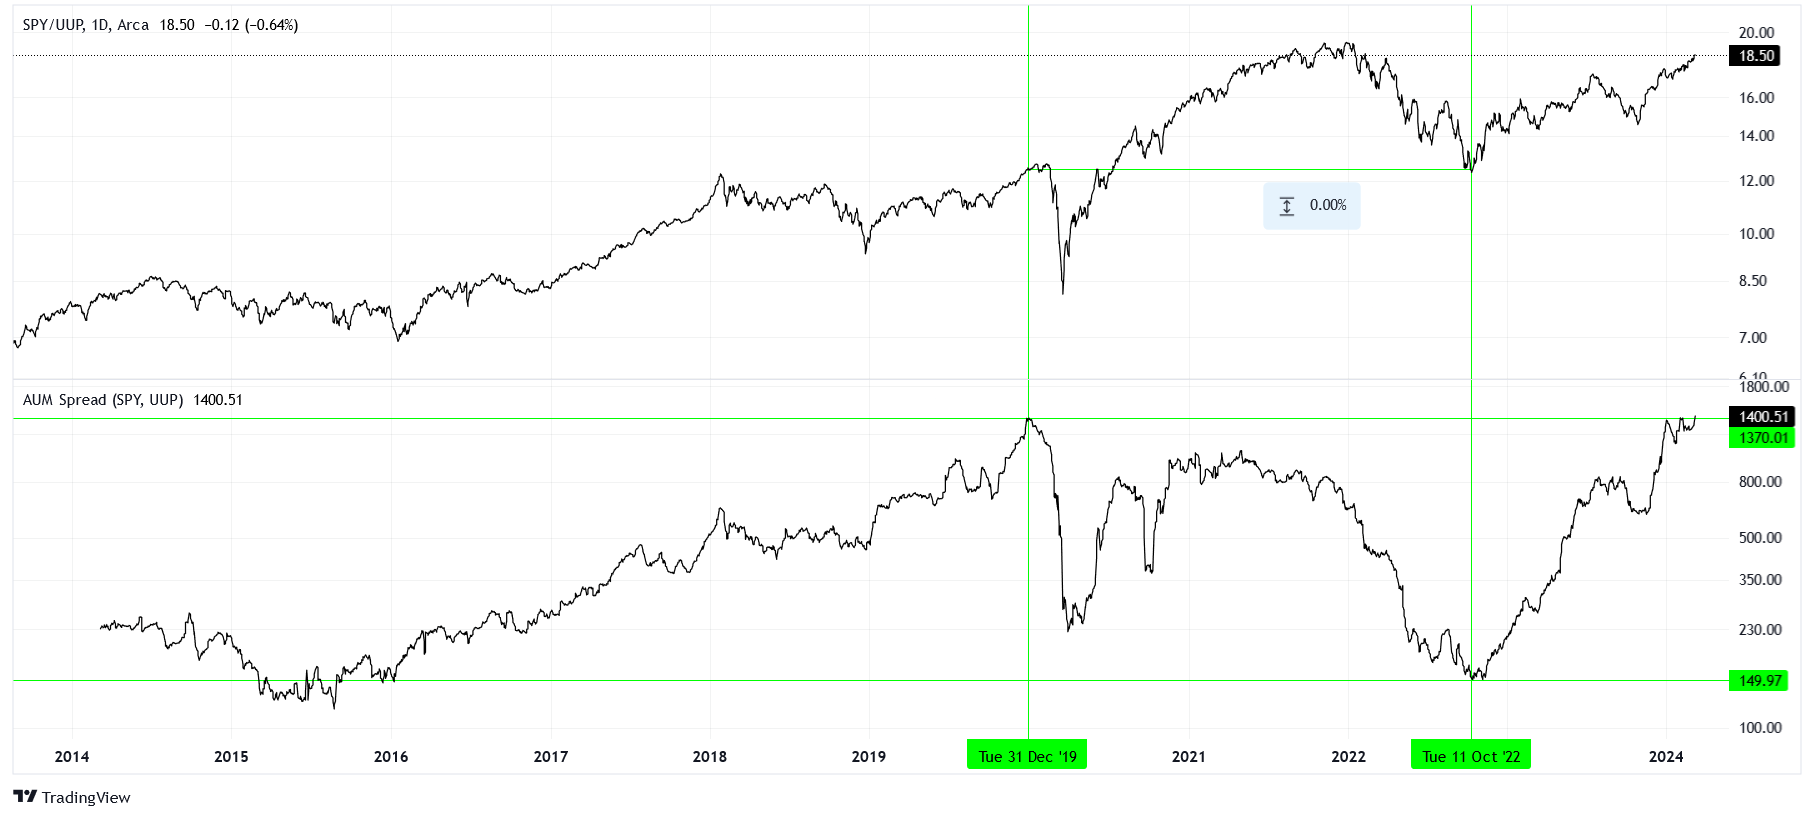
This time, the shift in money did not have a significant effect on the performance difference between the two assets in the medium-term. However, from a tactical perspective, one could have taken advantage of the COVID dip by being in the dollar. Overall, after the positioning reset, these two assets performed equally.
Finally, to clarify that this analysis is not a magic bullet, let’s look at a scenario where being a contrarian would have been quite painful: SPY/USO (oil fund).
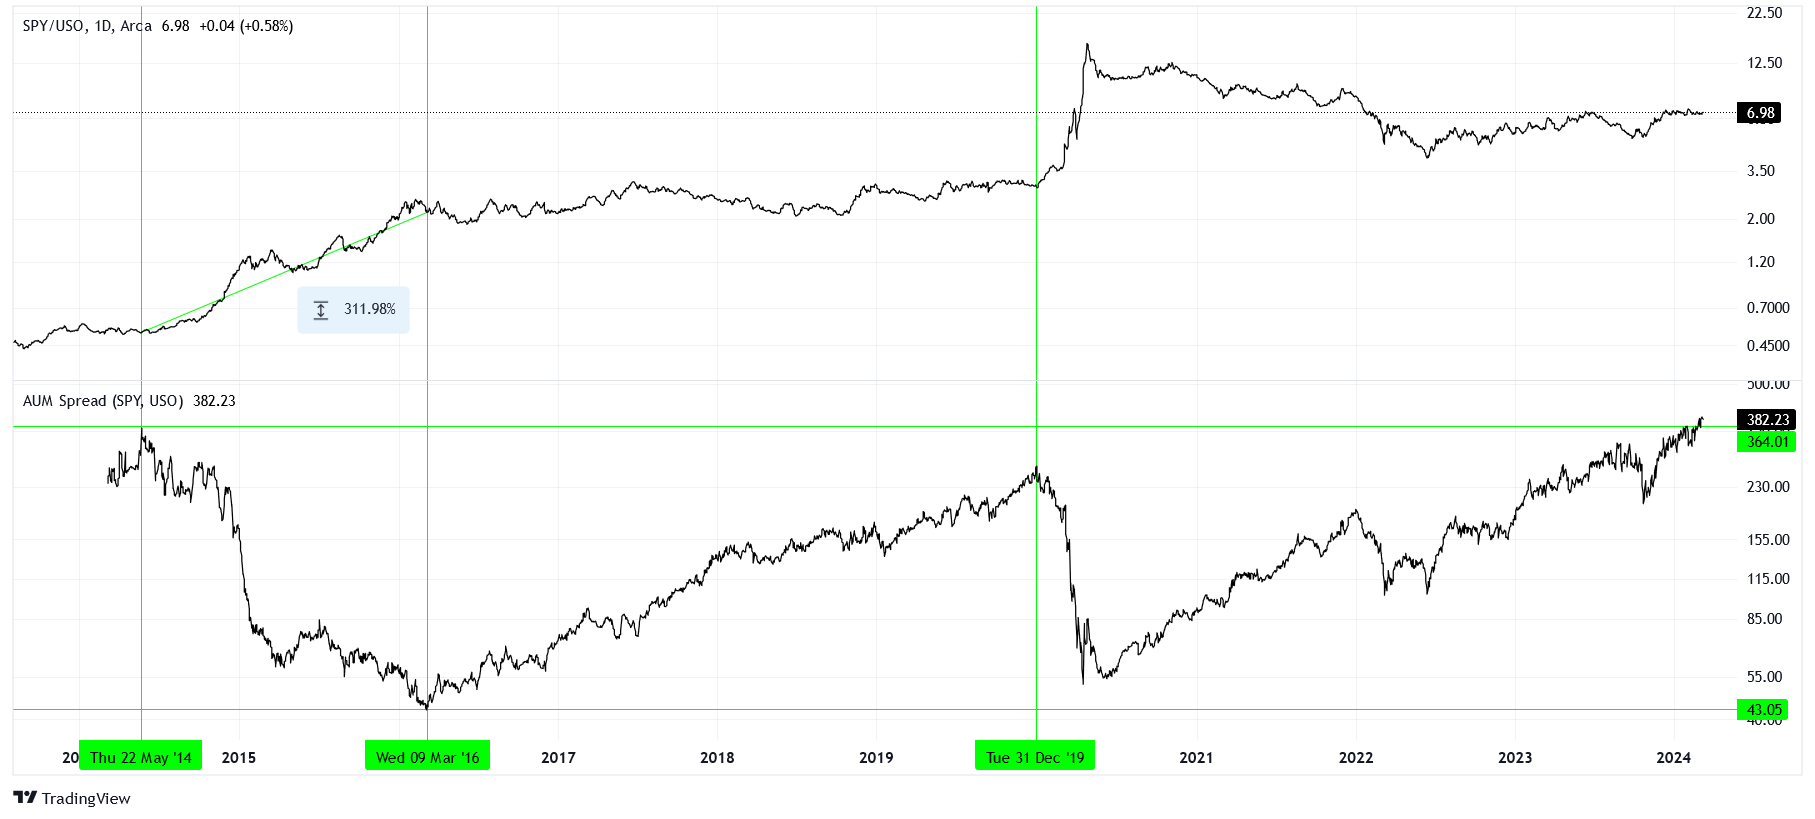
The last time the relative AUM ratio favored the SPY over the USO to this level, equities actually outperformed the oil fund by over 300% by the time the positioning had reset! Investing in USO over the SPY using this technique would have been a detrimental move. In fact, it is as if these funds are negatively correlated in some way, and this analysis is virtually useless in this case.
Conclusions
Incorporating AUM into our market analysis provides additional insights into where money is flowing and where potential opportunities may arise in the future. While not a perfect indicator of positioning or sentiment, it can be a powerful tool when used thoughtfully and with a large dataset (consider summing multiple ETF AUM values over similar themes).
Currently, the majority of capital is focused on mega-cap U.S. equities. Due to this heightened capital focus, there are numerous overlooked investment opportunities both domestically and internationally.
What opportunities can you find?