

Calling the Top (pt. 1)
We're in for a bumpy ride.

In this week’s article, we review evidence for the case of excessive bullishness.
A Fool’s Errand
Far more money has been lost by investors in preparing for corrections, or anticipating corrections, than has been lost in the corrections themselves.
– Peter Lynch
Calling market tops is a silly thing to do. Yet here I am, thinking that we are close.
I was originally hoping that all the relevant information would fit into one post, but eventually it was split up to make the read more manageable.
To begin, we will break down the constituents of our sentiment indicator.
Sentiment
Last week, we looked at our sentiment indicator.
For reference, here it is again:
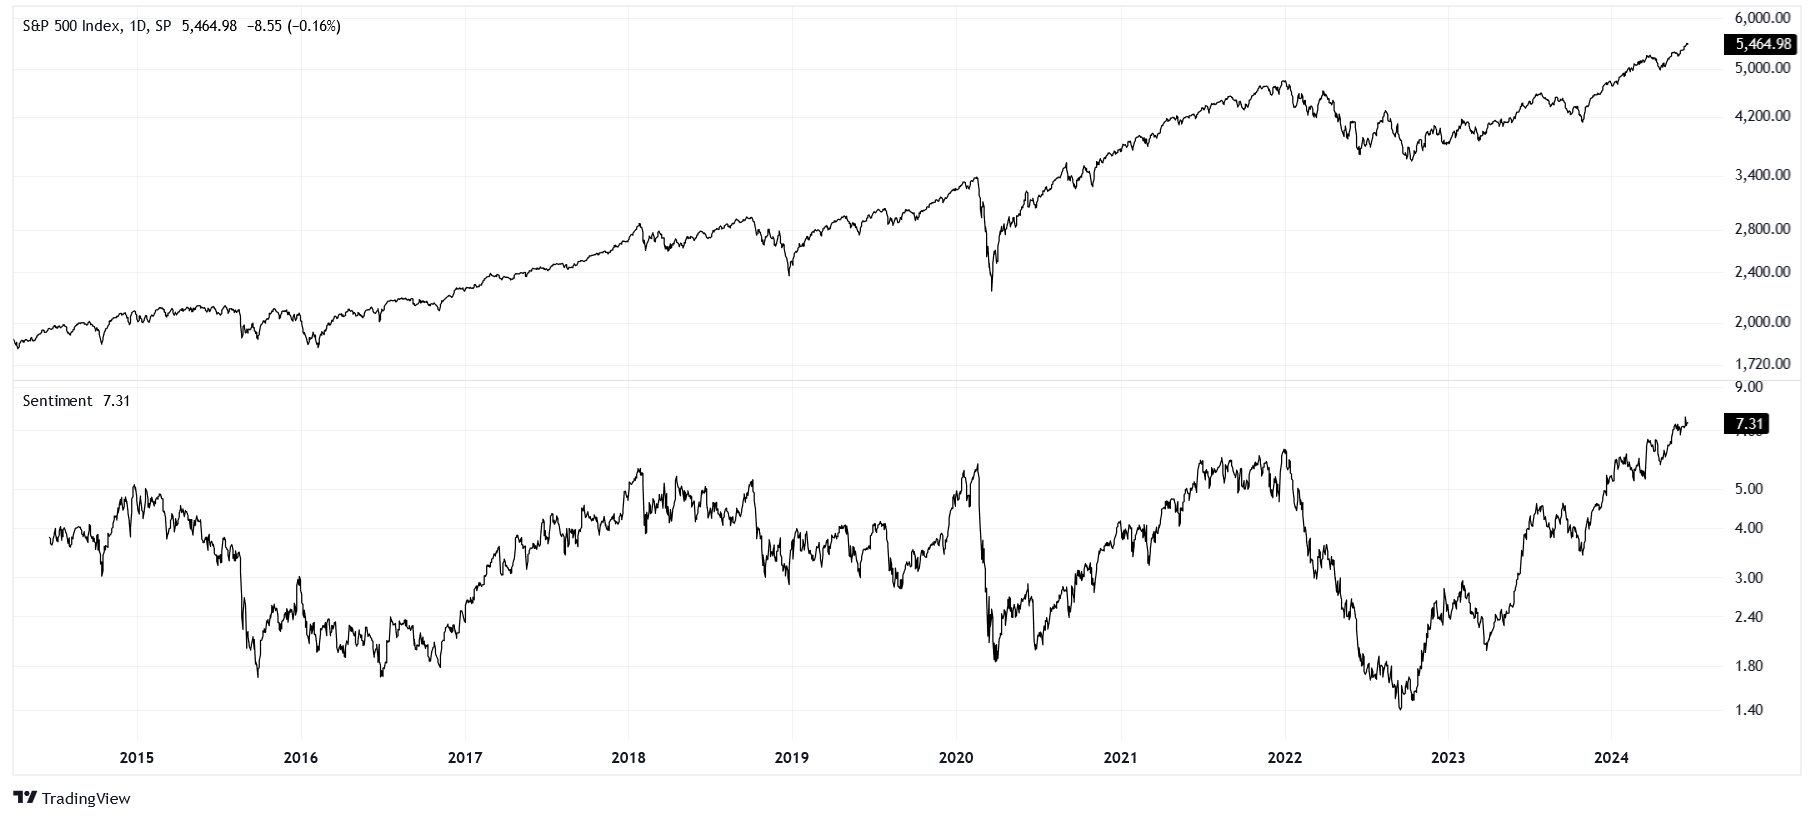
The S&P 500 cash index (SPX) is just one of the many American equity indexes we could use. We prefer the SPX because it is the most popular index, not because it is somehow “better” than the others.
On the other hand, our sentiment indicator is a custom work. It incorporates data from three main categories and several series. We use their combined interaction as a more balanced view of overall sentiment.
Today, we will decompose this indicator to understand what it is telling us.
Futures
To begin, we will isolate the futures positioning portion of the indicator.
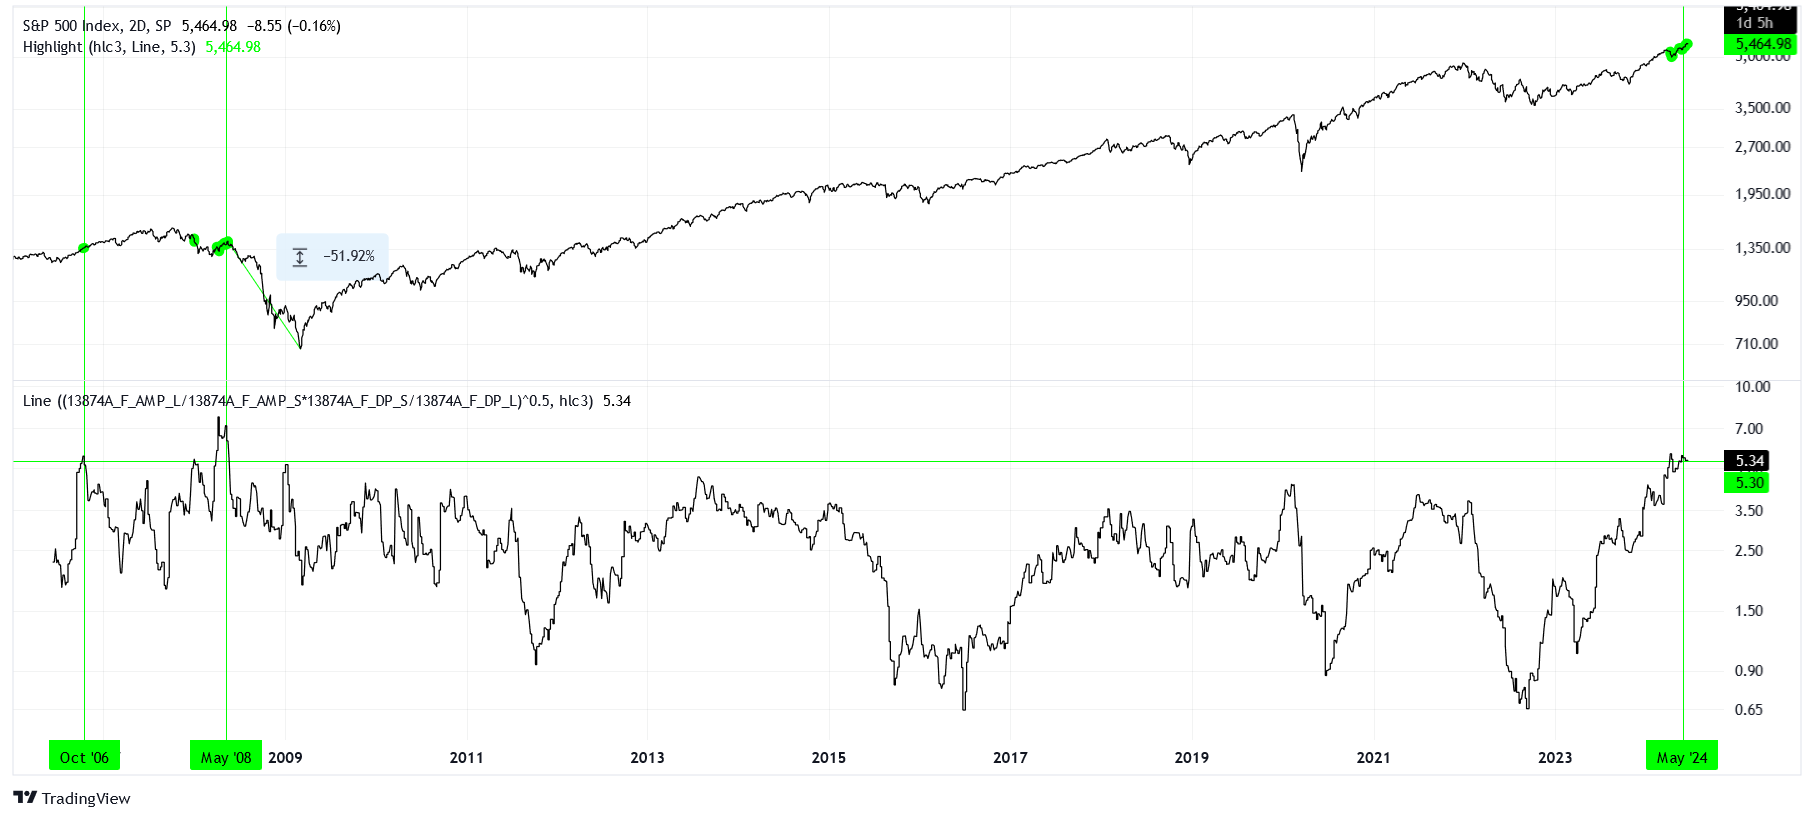
Fortunately, TradingView offers data from the Commitments of Traders (COT) report, which is how we have such nice S&P 500 E-mini futures (ES1!) positioning series.
From this data, we can define dumb money as asset manager longs over shorts. Since smart money (dealer’s positions) takes the opposite side of the trade, we have their shorts over longs. Finally, we take the product between dumb money and smart money.
Pitting dumb money against smart money, we find that ES1! positioning is the most bullish it has been since May 2008. Before that, only January 2008 and October 2006 saw such extremely bullish positioning.
It is worth noting that between October 2006 and October 2007, ES1! prices would push higher by about +15%. In retrospect, this small reward pales in comparison to the market risk soon to follow. If you had exited in October 2006, you would have been spared the -50% decline into March 2009. Another way to look at it could be that it took until July 2012 for price to leave behind the October 2006 levels for good.
Futures positioning is telling us that if we were to exit today, we would be in good company given history. Do derivatives tell us the same?
Derivatives
Next, we will look at the options volatility component of sentiment.
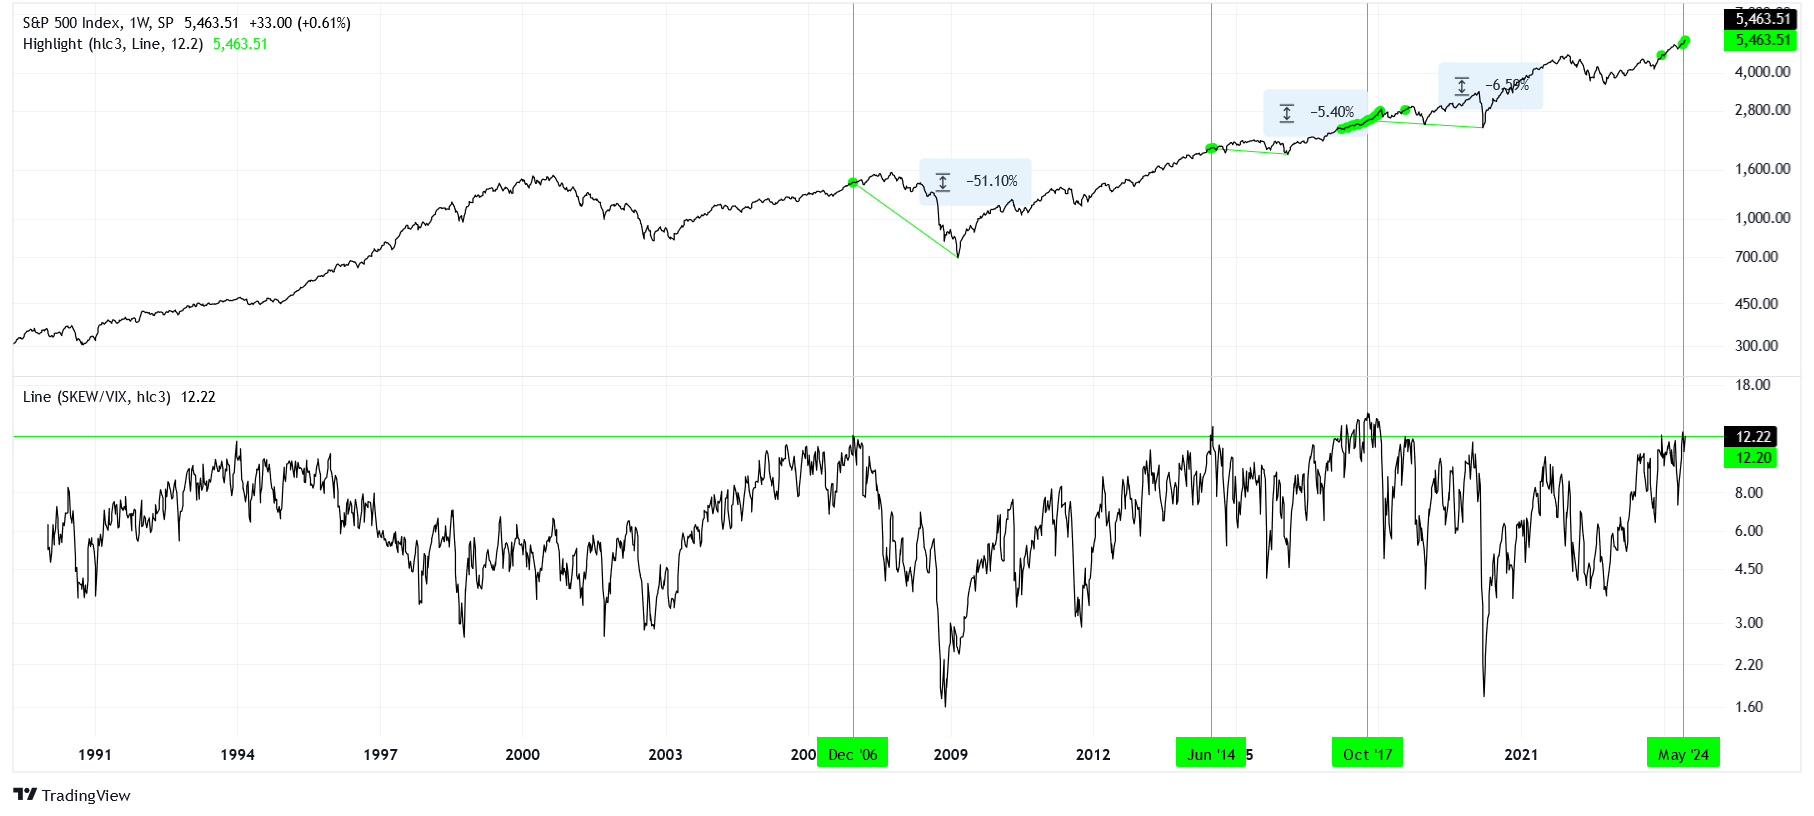
Taking the ratio between tailed options volatility (SKEW) and overall volatility (VIX), we find that our current situation is as muted (bullish) as October 2017, June 2014, and December 2006. We have already discussed what it would mean to exit the market in late 2006, but let us simulate an exit point for the other two periods.
If you were to stay out of the market starting from October 2017, you could have missed +32% upside potential into January 2020, but this would quickly reverse to -6.6% by March 2020. Between 2018 and 2020, the market experienced a lot of volatility for no reward.
For the June 2014 scenario, it is a similar lesson. You could have waited until February 2016 for a level that is -5.4% below the original.
These discounts are minuscule in comparison to the 2009 drawdown, but they represent lost investment time. We would be better off being invested in other asset classes during periods like these.
Funds (Leverage)
Finally, we can examine the fund portion of our sentiment indicator. Essentially, we are taking a spread of assets under management (AUM) between bullish and bearish leveraged exchange-traded funds (ETFs).
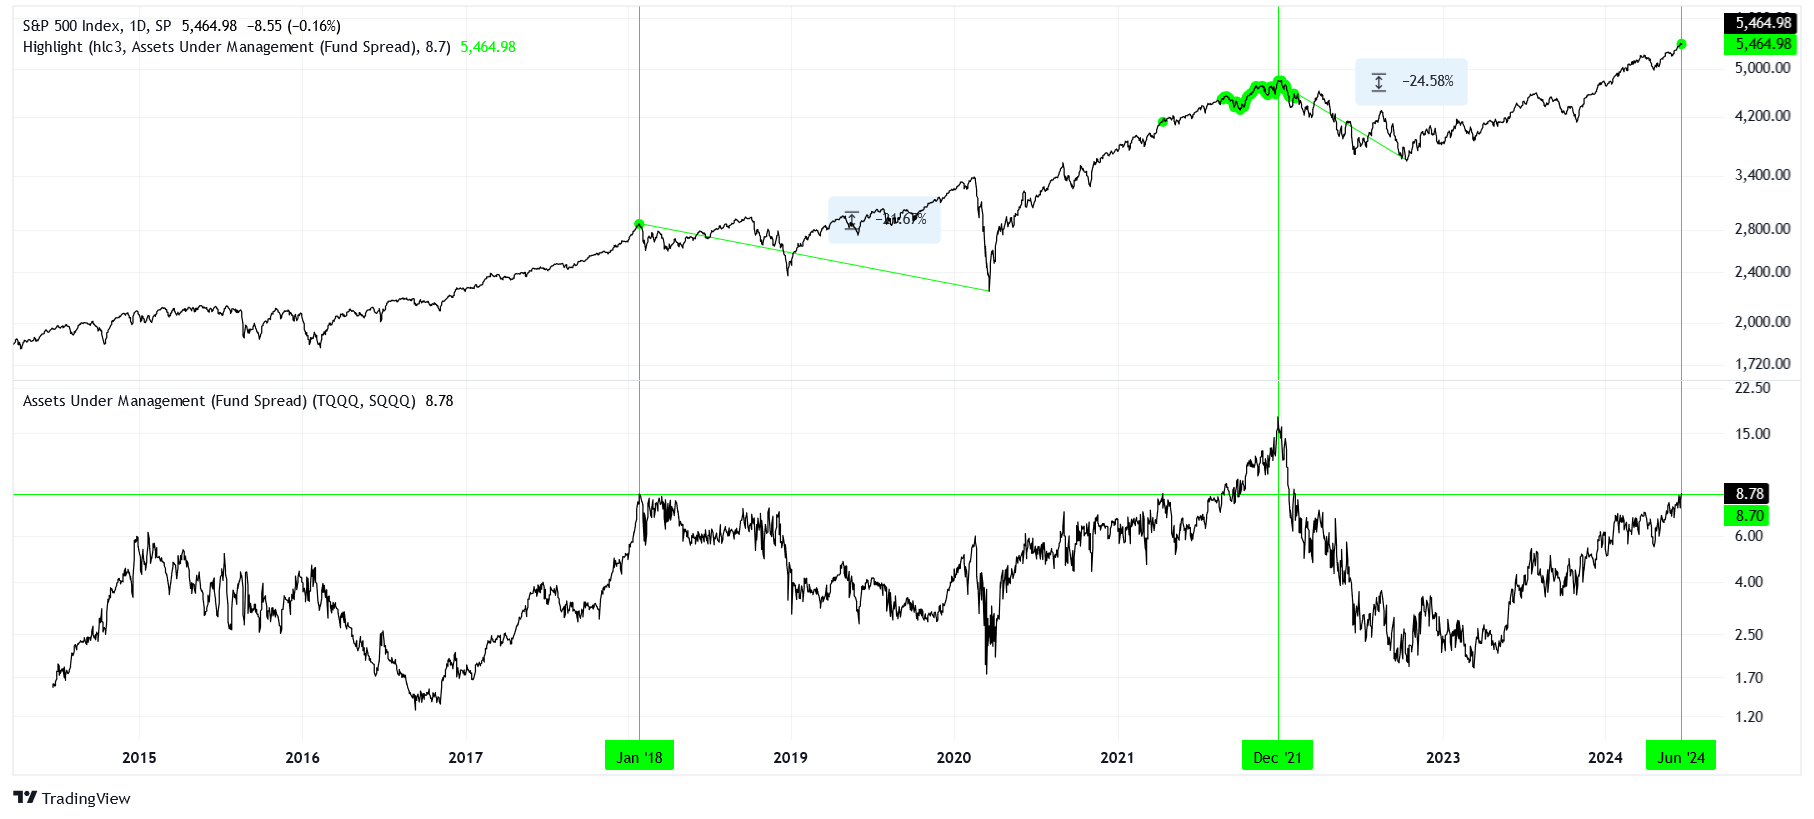
We have not seen an allocation in these funds as or more favorable to bulls since the feverish market of December 2021. Although more restrained, January 2018 shows similar bullishness. We already discussed a hypothetical exit in late 2017, which would be akin to an exit in early 2018. The main difference is that a January 2018 exit would have kept us even more comfortable along the journey to March 2020.
Regarding December 2021, an exit at this time could have avoided a -24.6% loss into October 2022. Another way to think about it could be that between April 2021 and October 2023, the SPX was flat.
Conclusion
Our sentiment indicator is composed of a total of eight data series and is organized into three main components. When we break down the indicator into more granular views, we find that current readings are like those of previous market tops.