

Euphoria
A quick look at sentiment.

In this week’s article, we find that bullish sentiment has been pushed to the extreme.
Mood Check
We’ve featured it before and we’re taking a look at it again, the sentiment indicator:
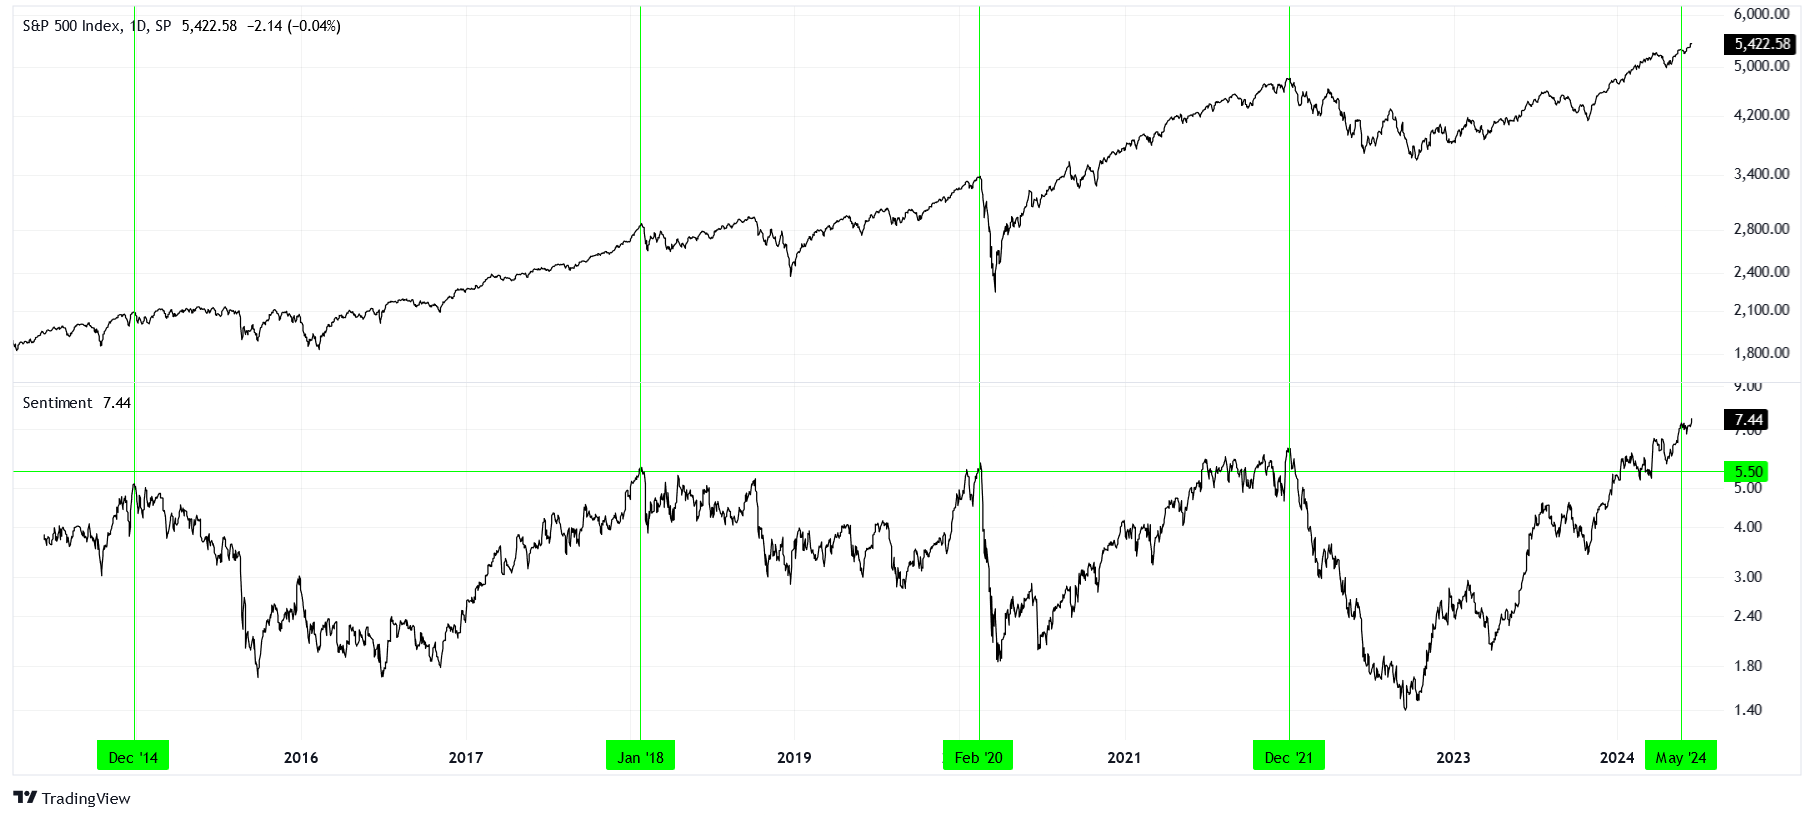
Briefly, this indicator incorporates futures positioning, options volatility, and ETF leverage into one series. Currently, we are measuring readings that are eclipsing the previous all time highs in bullish sentiment.
We can pick a level, say 5.5, and make comparisons across the last decade.
December 2021, February 2020, and January 2018 all broke this level, but didn’t extend much further. December 2014 got very close to breaking this level. Now, in June 2024, we have surpassed that level and have gone well beyond.
Significance
Think about those periods mentioned in the last paragraph.
December 2021 marked the market highs before the prolonged correction that followed for most of 2022. February 2020 was just moments before the COVID crash, one of the sharpest declines in the history of the S&P 500. January 2018 set off a wave of volatility that wasn’t properly dealt with until arguably the crash of 2020. December 2014 was similar to 2018; there was not an immediate correction to the downside, but the unwind would last a couple years.
The way people are positioned today is more extremely bullish that any of those periods mentioned. This means there is a lot of money to be made as those positions unwind. I will have a much longer write up next Sunday.
Be careful.