False Comfort
Don't get used to it.
In this week’s article, we find the crowded trade.
Dealers are Short
The Commodity Futures Trading Commission (CFTC) releases a weekly report on the Commitment of Traders (COT) which gives us a view into futures positioning among different trading groups.
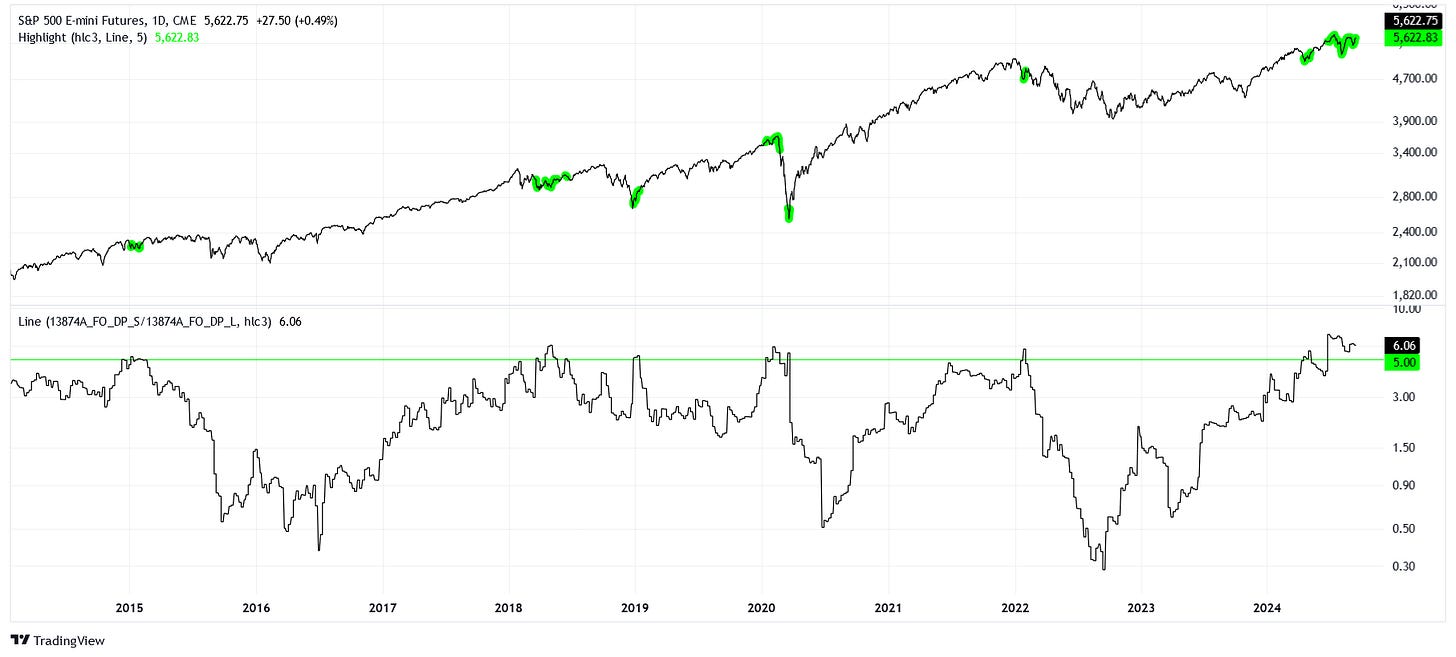
For example, we could take a look at the positions of dealers, who tend to be “smart money” in any given trade. If we were to take the ratio between their short and long positions on the S&P 500 E-mini futures (ES1) market, we get the following:

Currently, the ratio between dealer shorts and longs is 6.06. For every long position, dealers have on about 6 short positions. In the chart above, you can see the green highlight corresponding to when this ratio is at least above 5. Not every highlighted period demarcates a good place to be liquid, but the majority do.
It’s important to note the range of this ratio. At the bottom of the bear market in 2022, dealers had a short ratio of 0.3, which means that for every short position, dealers had on about 3 long positions.
I wonder, what other groups could be trading the S&P 500 futures?
Managers are Long
You may want to believe that asset managers are competent, but I don’t.
Somehow, managers routinely bet against the house. While dealers are comfortable being short here, managers have gotten even more comfortable being very long.

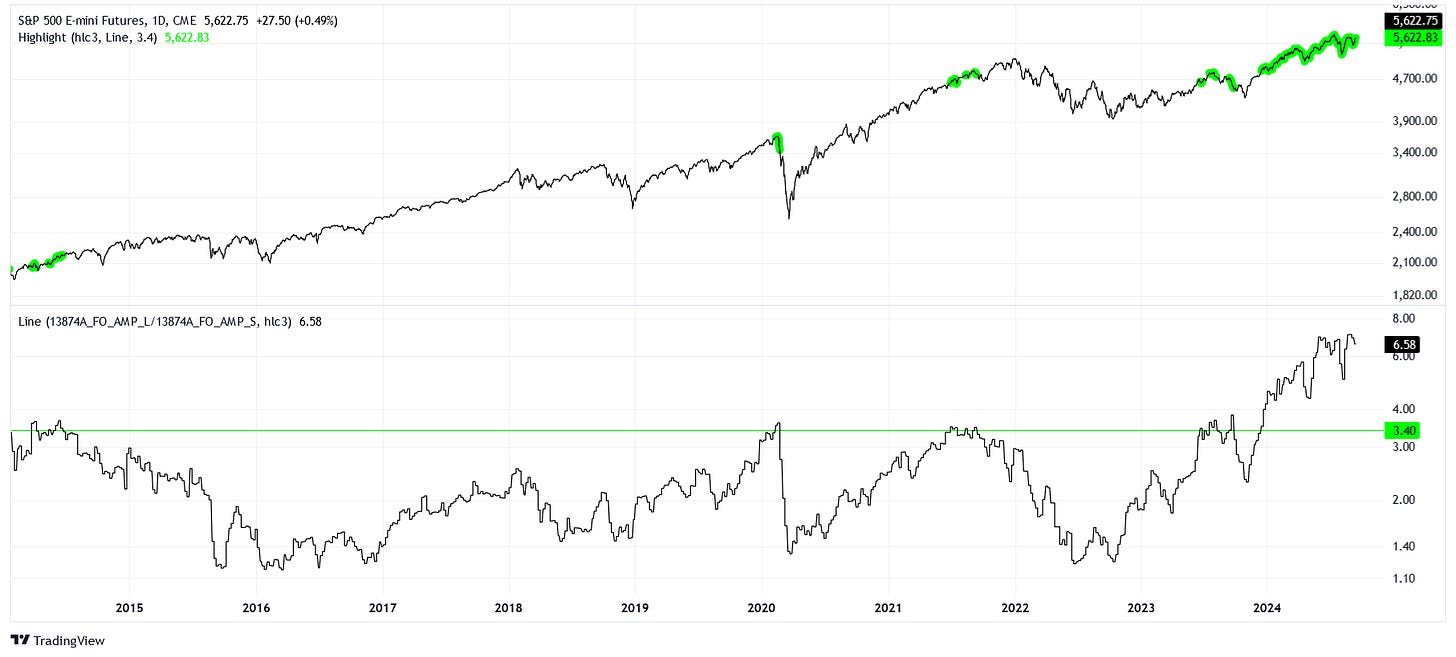
You may be wondering about what’s different in the chart above compared to the previous. Here, the ratio on the bottom plot is inverted. We’re instead taking the manager’s long positions over their short positions.
Currently, for every short position managers have, there are roughly 6.6 long positions. The previous highs of this range were around 3.4, so managers are almost twice as extended as they ever had been in this series.
Once again, let’s consider the bottom of the range, which is close to 1.1. This means that managers have a long bias, unlike the short to neutral bias that dealers have. Crucially, the dealers have not over-extended themselves over their previous range, but asset managers are incredibly bullish here.
Is there some way we could consider both positions at once?
Utraque Unum
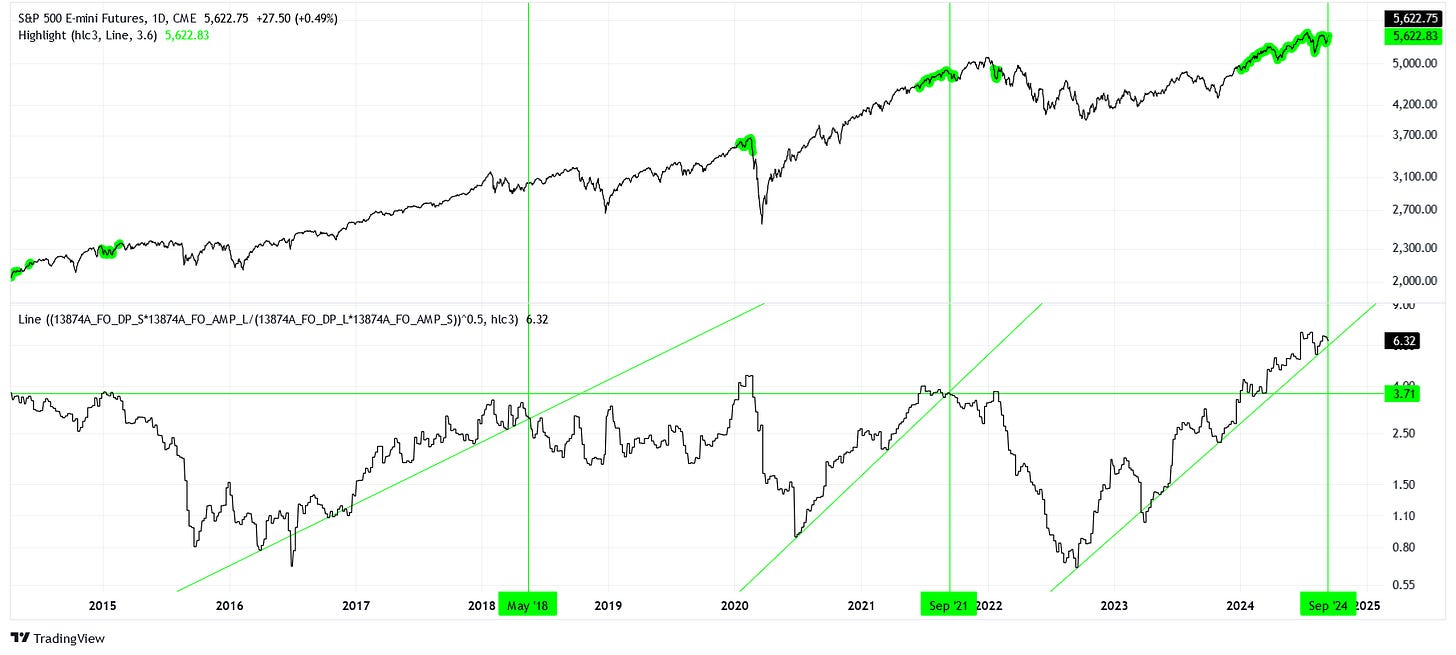
We can balance the ratios by taking their product and then the square root of that product. Really, this is just a fancy way to take an average of ratios.

Using this new interaction ratio, we can see that a highish value would be above 3.6, but we’re all the way up to 6.32! The bottom of the range is all the way down at 0.67.
I drew some ascending trendlines on the ratio plot and then associated vertical lines to the breakdown of these trends. While we have not yet broken the current trend, we appear to be approaching an inflection very soon.
When a rising bullish positioning trend breaks, you can expect a diminishing reward to risk ratio into the future. We could have the patience to allow this positioning ratio to moderate before deploying our cash into equity indexes in a big way.


