

February 2024
Wolves at the gate?

In this issue, we review January 2024, take a look at flows, and present an investment opportunity.
January in Review
The past month witnessed a continuation of the rally that began in November, albeit at a slower pace. The S&P 500 rose by +1.59%, Nasdaq Composite by +1.02%, and Dow Jones Industrial Average by +1.22%. However, the Russell 2000 missed out on the gains, declining by -3.93%. Globally, the Japanese Nikkei 225 had an impressive January with a +8.43% increase, while China experienced the opposite with the SSE Composite losing -6.27%. Finally, the STOXX Europe 50 outpaced America with a +2.20% gain.
While the U.S. 10-year government bond rate remained mostly unchanged and the Federal Funds rate was held constant, the U.S. Dollar index increased by +2.10%. Simultaneously, the S&P 500 Volatility index rose from 13.22 to 14.35, indicating an uptick in expected movement for February.
The S&P Goldman Sachs Commodity Index (GSCI) moved higher by +3.62%, influenced by WTI crude oil futures increasing +6.29%. On the flip side, gold declined by -1.14%, and silver declined by -3.59%. Additionally, Bitcoin is signaling market disagreement with a 27.4% spread between January’s high and low prices, but only realizing a modest +0.71% gain from its open.
Equity Flows
The most active stocks likely will not surprise you: NVIDIA (NVDA) had $597B in gross flows and increased in price by 23.52%, while Tesla saw $439B change hands but decreased by -26.58%. Advanced Micro Devices (AMD) gained +12.17%, Apple (AAPL) lost -4.90%, and Microsoft (MSFT) rose by +5.74%.
Besides Tesla, other shocks to the system include Boeing (BA) moving down by -19.04%, Humana Inc. (HUM) down by -17.30%, and the others included in the heat-map below.
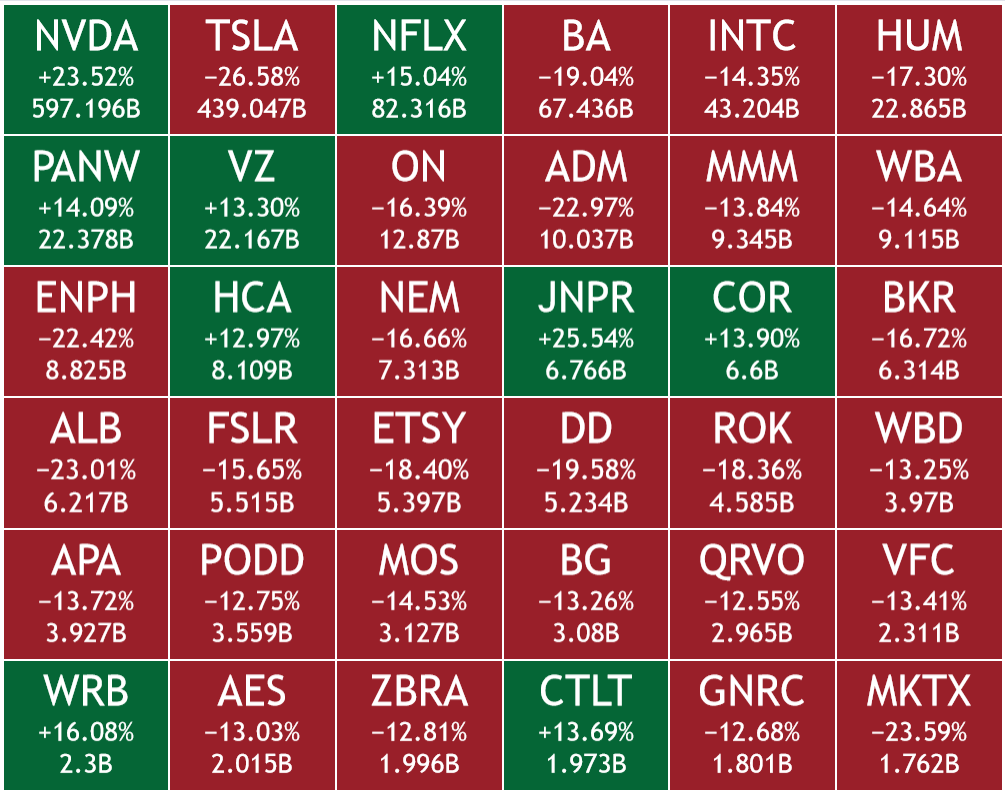
Despite the headline index making new all-time highs, the heatmap above shows more stocks moving down by -15% than the stocks increasing by +15%. This should raise concerns about the underlying health of this market.
Fire Sale
If you have a strong stomach, this may be a wonderful opportunity.
Medical Properties Trust, Inc. (MPW) is a self-advised real estate investment trust (REIT) established in 2003, focused on the acquisition and development of net-leased healthcare facilities. Currently, they own 437 properties with ~43,000 beds among them, encompassing rehabilitation hospitals, long-term acute care hospitals, ambulatory surgery centers, hospitals specializing in women and children’s health, regional and community hospitals, medical office buildings, and other single-discipline facilities.
Now onto the juicy details. MPW is down -87.15% from its early 2022 peak. Back during the Great Financial Crisis (GFC), this REIT had lost -83.47% from the peak, as illustrated in the chart below.
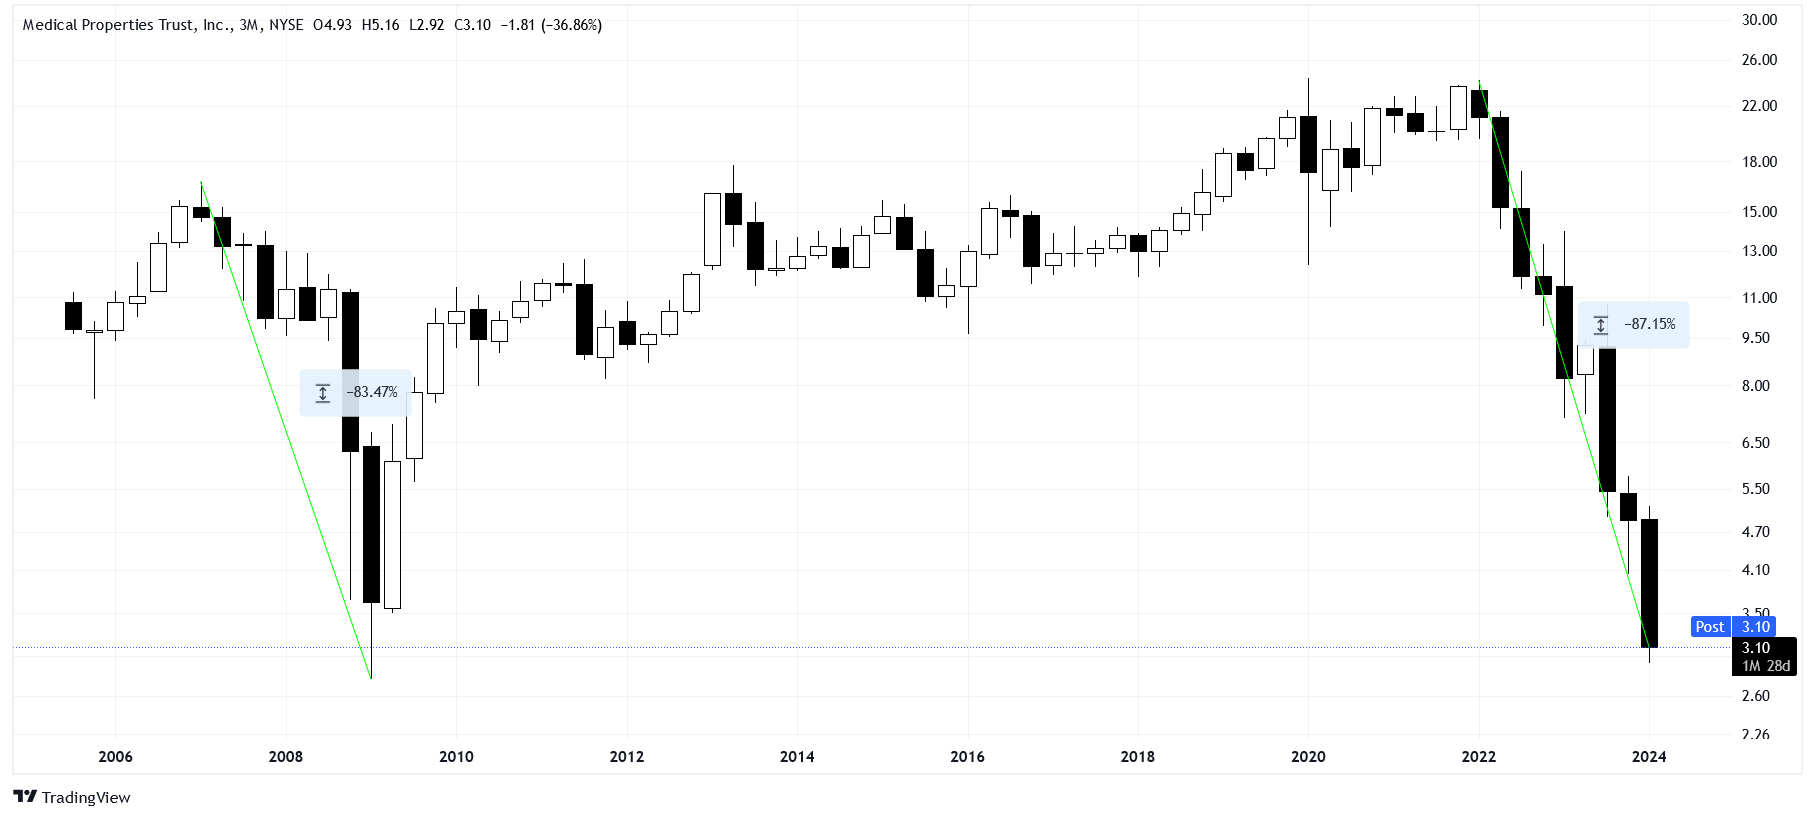
Despite their current negative earnings, which is not ideal, their price-to-sales ratio is lower now (1.35) than the 2009 lows (2.32). Additionally, their price-to-book is also lower now (0.22) than in the 2009 lows (0.42). The big question is their debt, a whopping $10.31 billion of it. However, barring any drastic changes in asset valuations, they have $19 billion in assets to cover that debt.
This is a high-risk setup, but high risk can yield high rewards for the brave few who choose to jump into the flames.
Warnings from the Dismal Science
Five Federal Reserve branches each report a manufacturing index: Dallas, Kansas, New York, Richmond, and Philadelphia. Without determining which Fed is the “best” Fed, we can simply take their average, as shown below.
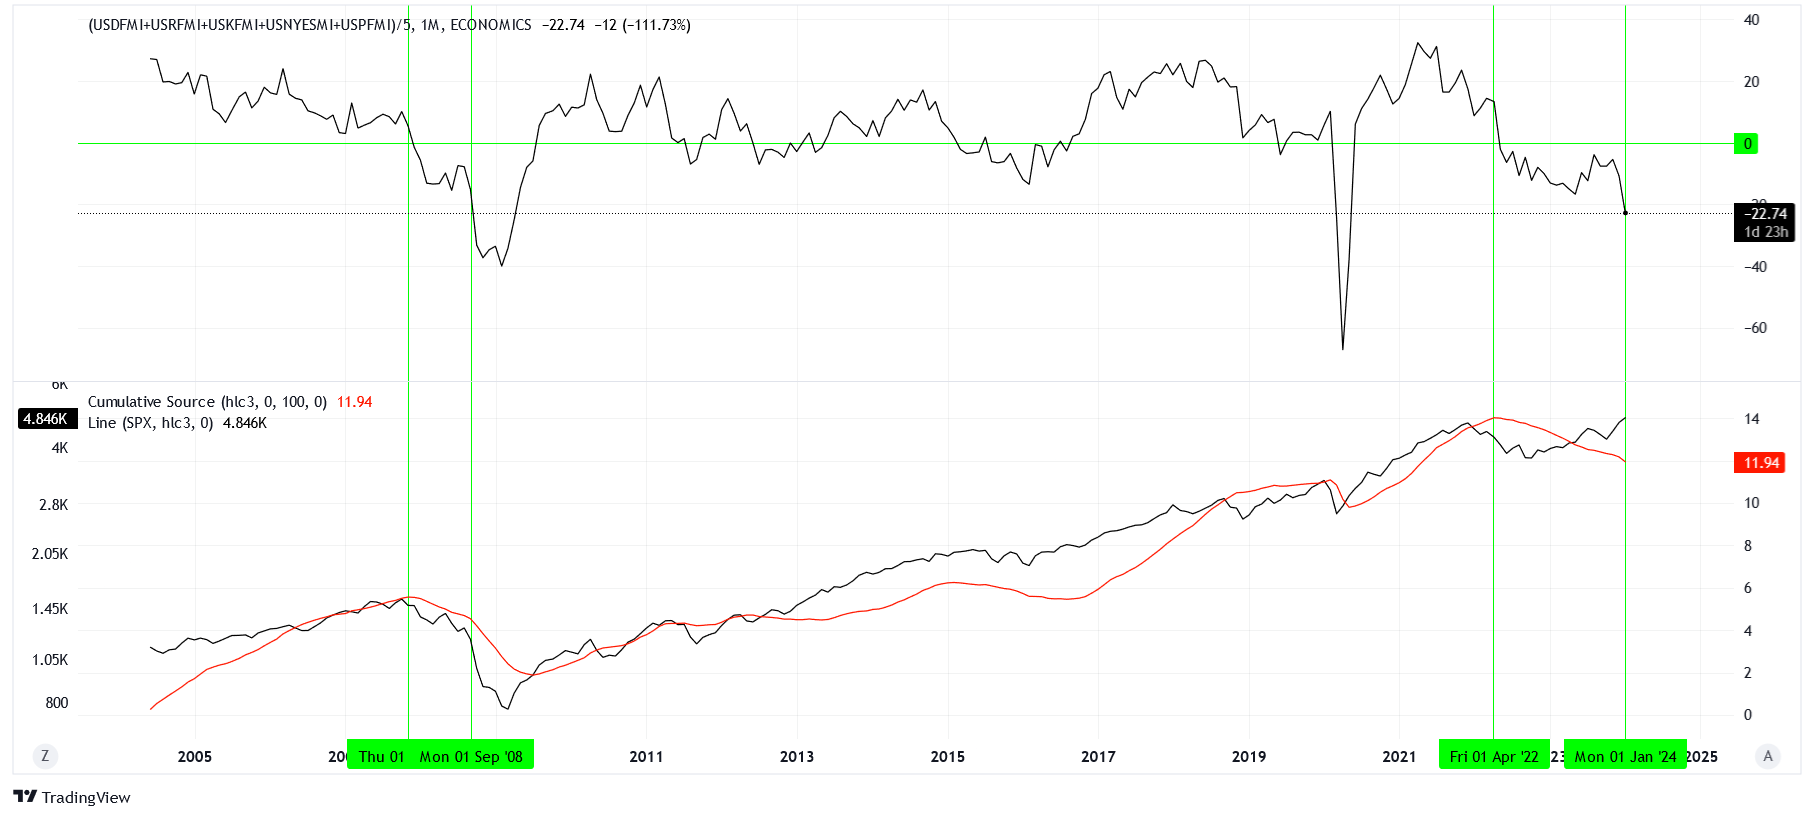
The current reading for this mean index is -22.74. Excluding the COVID-19 pandemic, the last time we saw a similar reading was September 2008. Despite this, the index has been reading negative since April 2022. However, the market has rebounded since October 2022, seemingly ignoring this economic deterioration.
Caution is advised.
Inspired by a podcast featuring John Williams of Shadowstats.com, I investigated the discrepancy between reported gross domestic income (GDI) and gross domestic production (GDP). The chart below highlights moments where reported GDP was +1.14% above reported GDI.
While it is essential not to base investment decisions on one indicator alone, we have recently experienced two signals of GDP being unrealistically high compared to GDI. Historical precedent suggests that this has marked local peaks in 2007, 2000, and 1981. To put it mildly, these are not good bedfellows.
Once again, caution should be our guiding principle.
Disclaimer
The content provided is for informational and educational purposes. It is not financial advice. You are solely responsible for your investment decisions. The author assumes no liability for losses or damages resulting from decisions based on the content provided.