

Maintaining Momentum
Tweaking a popular indicator.

In this week’s article, we improve the momentum indicator.
Momentum
A common technical indicator is momentum, which is simply a lagged difference. Specifically, momentum is the difference from one price (at some time) to another. For example, most momentum indicators are parameterized with a whole number length, referring to how many trading days we should lag backward from any given point.
Say we have a length of 252, which is how many trading days there are in a year. If today’s close was $100 and the close 252 trading days ago was $90, then our momentum would read +10 for the current day.
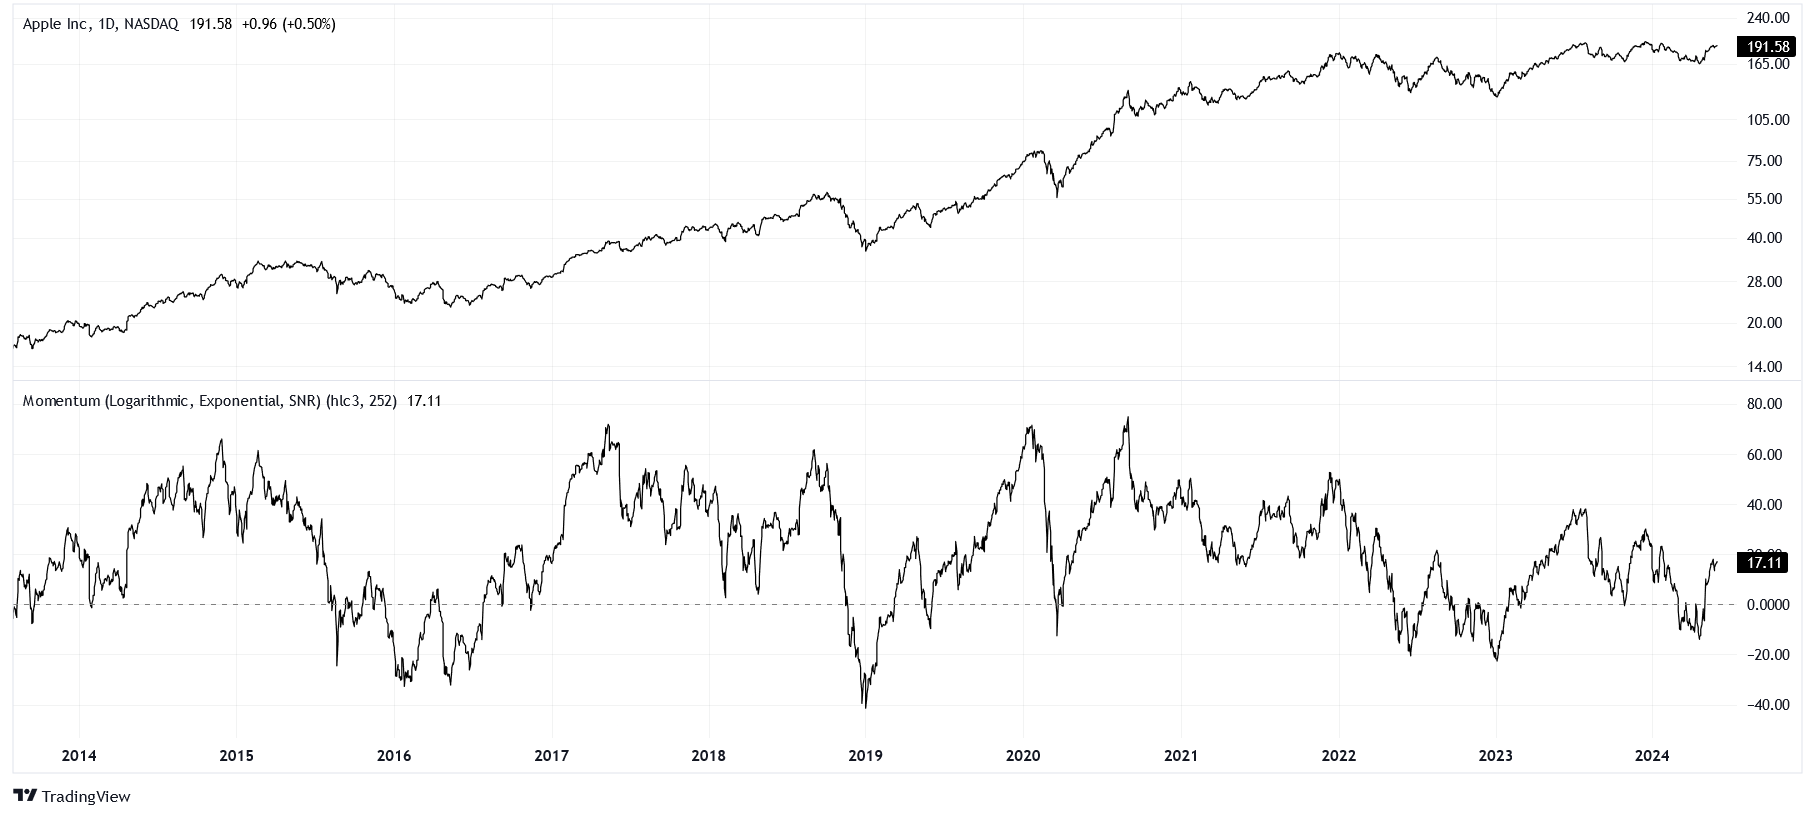
Here’s what that looks like in practice for Apple (AAPL).
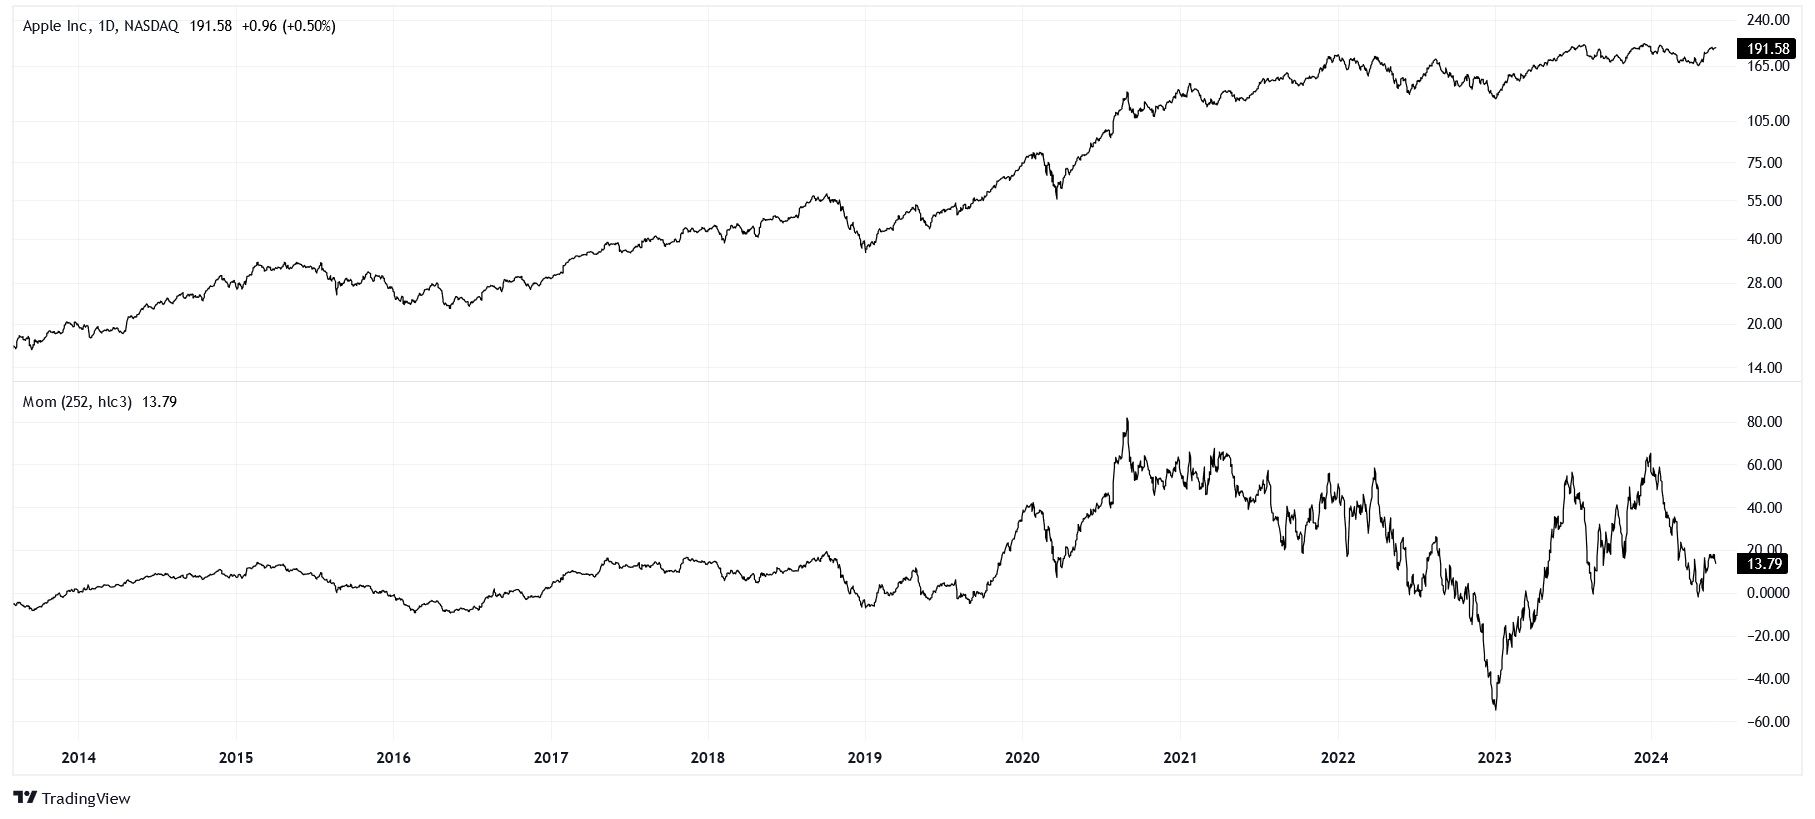
Notice that as time progresses, and the price of AAPL rises, the range of our momentum indicator is widening. This is the first mistake of the indicator; it doesn’t take into account the scale of price. What we prefer is a scale invariant indicator.
Another measure of change is percentage, which is scale invariant. After all, whether we go from $10 to $11 or $100 to $110, we would still be looking at a 10% gain, right?
Let’s make those changes.
Per Centum
The first adjustment to our momentum indicator is using a percent change instead of a difference. A percentage change is the difference between a new and old value, divided by the old value, and then multiplied by 100.
We can update the chart.
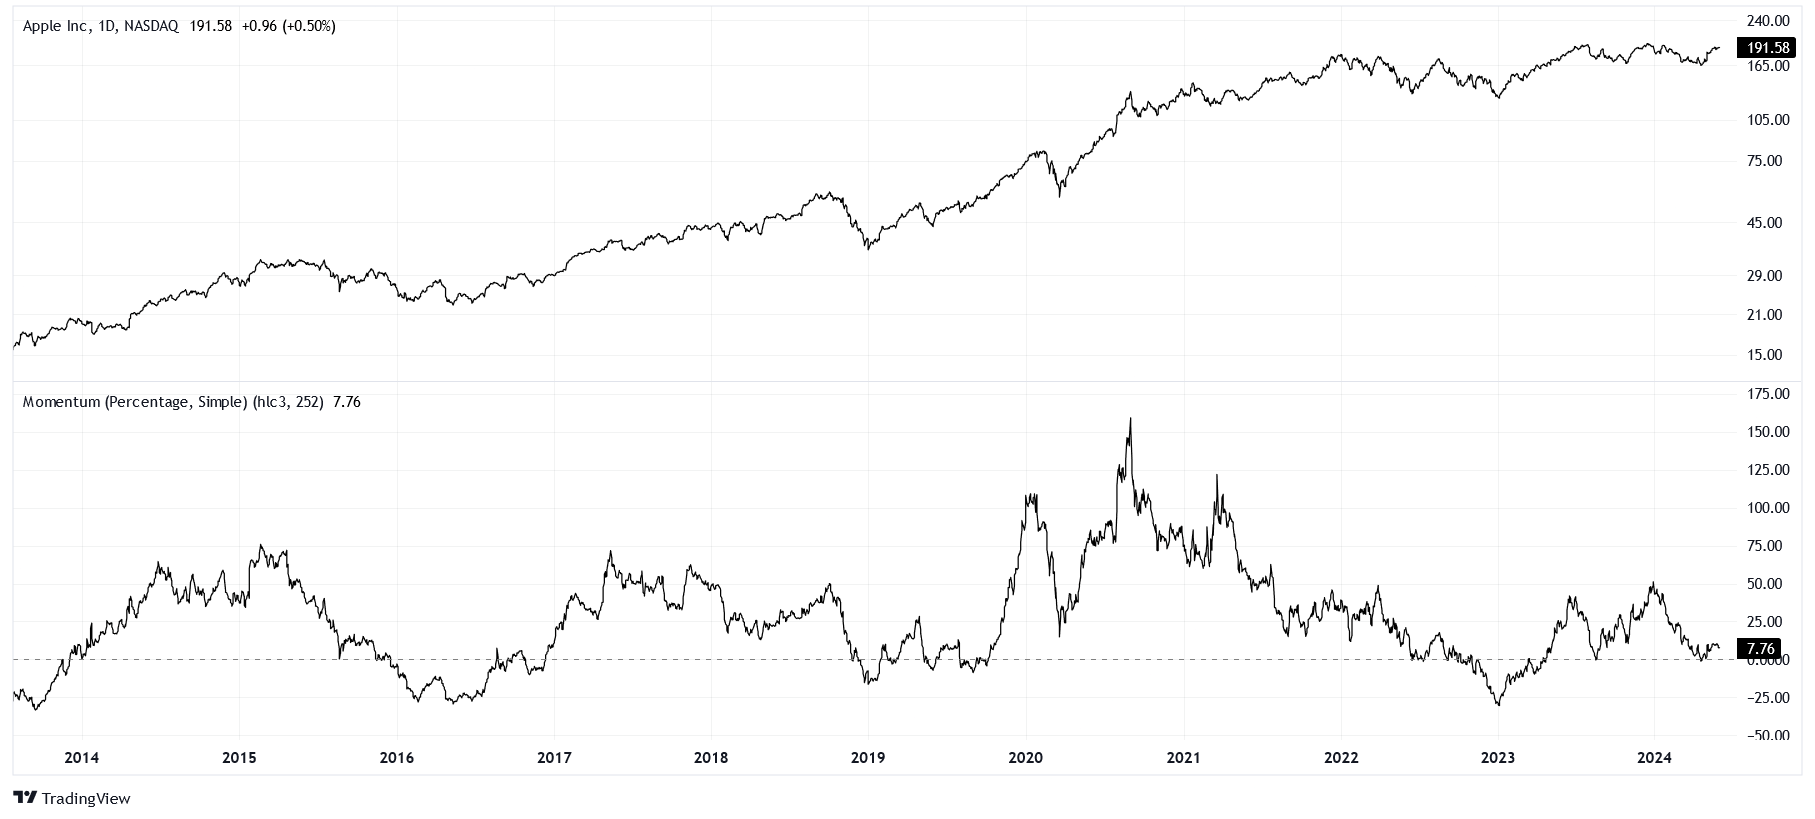
Much better, but let’s think about this.
A negative percent change is bounded between -100% and 0%. A positive change is bounded from 0% but unbounded up to infinity. For this reason, you might have noticed that the positive peaks stretch further than the negative troughs do.
Another way to think about this is that a -50% drawdown could be eliminated with a +200% gain, but the absolute values of those changes are not the same.
What might correct this?
Changing Logarithmically
We’ve learned about log change before, but it’s been a while. Let’s refresh.
Log change is simple. We start by taking the quotient between a new and old value, then take the logarithm of that ratio, and finally multiply it by 100. Technically, these are called centinepers (cNp). If we use a log function with a base of 10 instead of the natural logarithm and scale it by 10 instead of 100, we have decibels (dB)!
Log changes are wonderful because they are symmetrical. For example, -50% becomes -69.31 cNp (-3.01 dB) and +200% becomes +69.31 cNp (+3.01 dB).
Once again, we’ll update our chart.
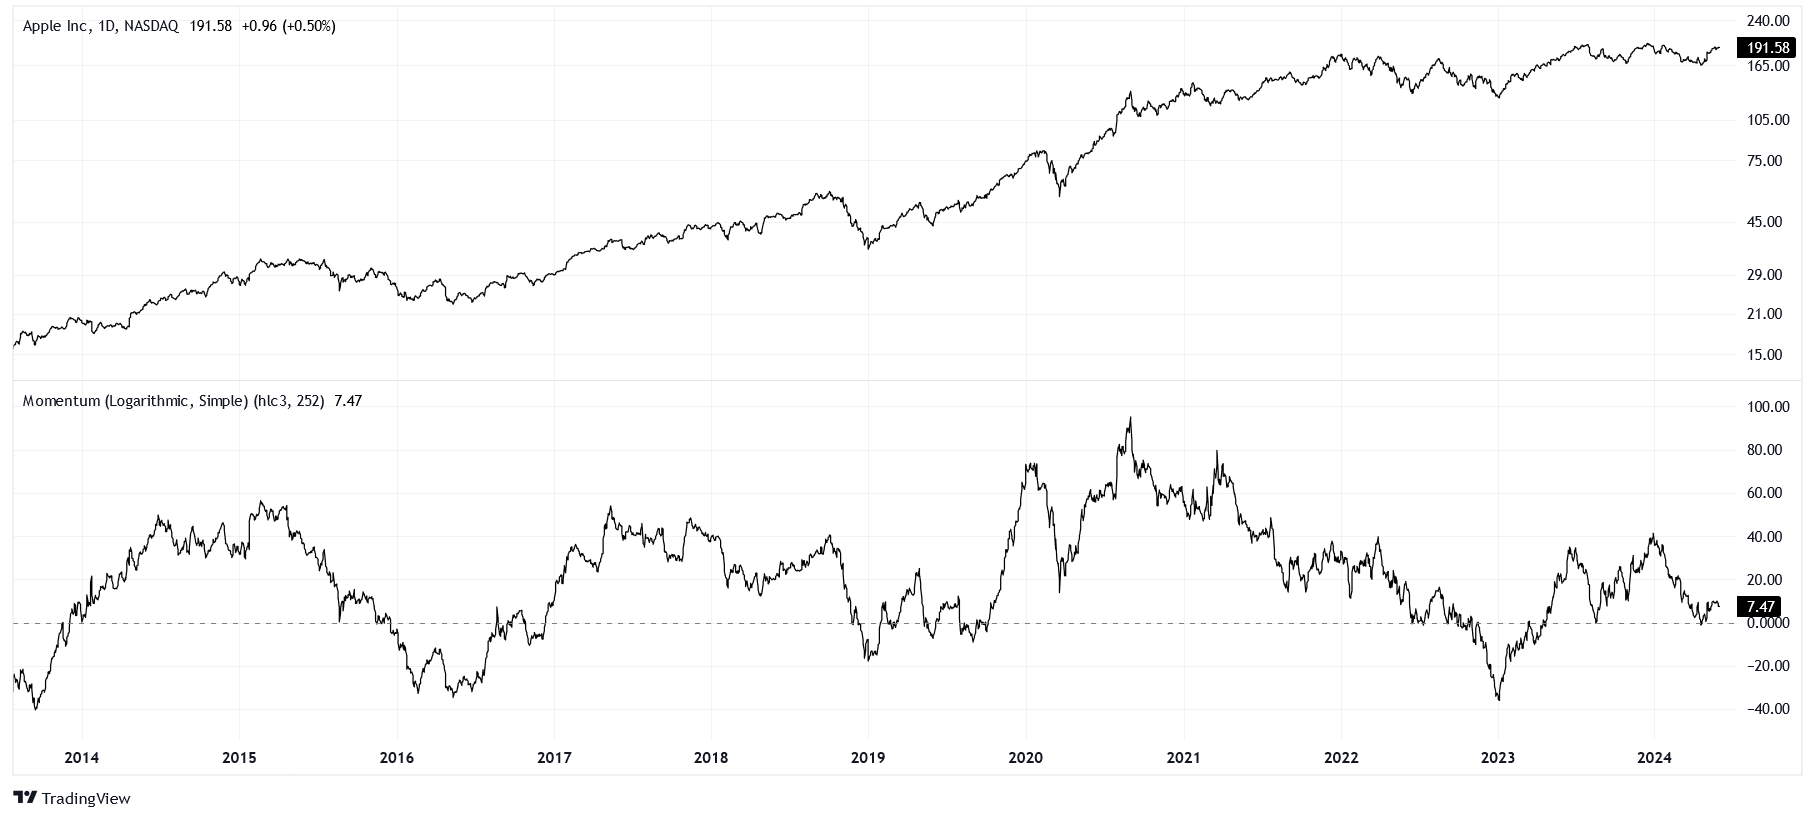
Excellent. That tweak dealt with all the weird stretching issues. It’s okay to monkey with indicators based on their “look and feel.” If your spatial intuition is strong, what looks “better” is usually closer to what is “correct.”
Believe it or not, we can do even better. When we are trading, what happened recently is more important than what happened long ago.
With a simple lagged window of time, we are essentially taking the mean of the daily changes between now and some time in the past. We don’t want to consider the daily change from a year ago as important as the one that happened yesterday.
So, what do we do?
Moving Exponentially
Exponential moving functions are simply beautiful.
For fear of this post getting too heady, we can save their mechanics for another day. Essentially, we are now taking the daily log changes (single step, not the full 252 days) and finding their mean using an exponentially-weighted window (this is 252 days long) instead of a uniformly-weighted window.
It can be a bit confusing.
With a little bit of fairy dust, we can get an exponentially-weighted log change momentum indicator up and running.
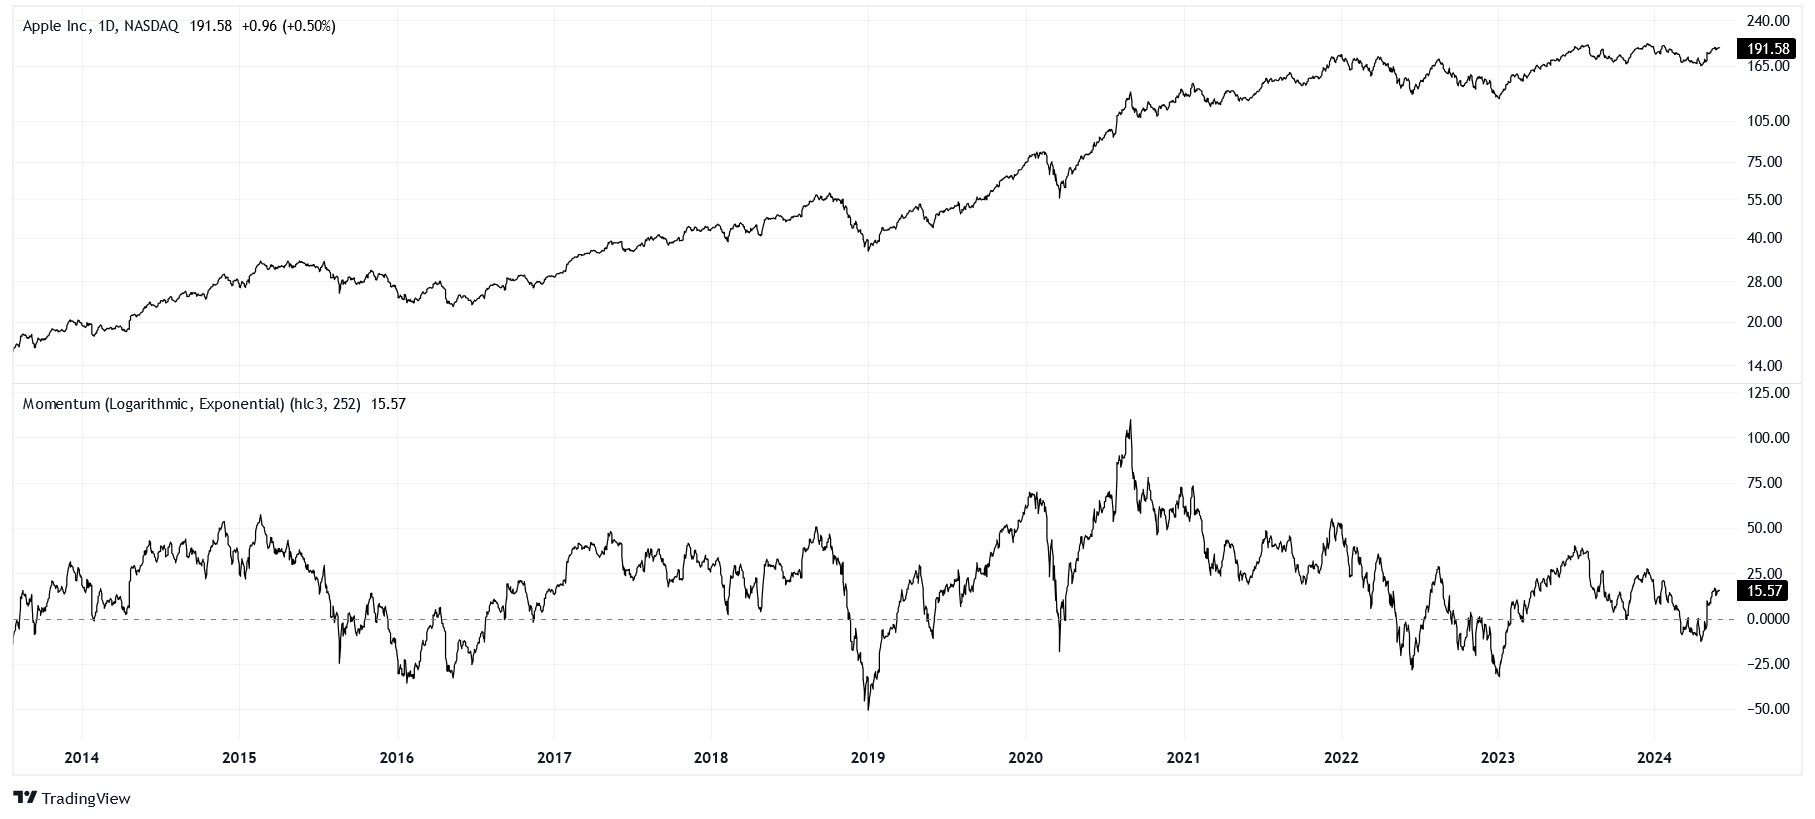
Take note of how the indicator is now more sensitive to recent events. It’s a slight change, but very important for considering the context of our momentum value.
We have now arrived at what I would consider to be a robust indicator. Momentum tries to inform a trader about how a stock is changing over time. Our indicator does the same thing with additional features: scale invariance, directional symmetry, and time sensitivity.
There’s absolutely nothing else we can tweak... right?
Wheat from Chaff
Okay, hear me out: We can change it again.
You’re probably saying, “Dilettante, you mad lad! It has to stop!”
No, it will never stop. We’re going to be here forever. Check this out.
What did we do this time?
We took the exponential log change and divided it by the exponential absolute log change. Basically, before we take the exponential mean, we calculate both the raw and absolute daily log changes. The ratio between the raw mean and absolute mean is what we’re looking at, scaled up by 100.
Why did we do that?
The absolute mean is the “total distance” that price travels in some window of time. The raw mean is the “actual distance” that price traveled in that window. Therefore, the bounds of our indicator are between -100% and +100%. If all of the distance is realized to the downside, the indicator reads -100%. If all of the distance is realized to the upside, the indicator reads +100%.
Admittedly, this indicator is not necessarily “better” than the previous; it simply depends on your context. Correcting for volatility evens out the signal between low and high volatility periods, but this is not always desired.
Apples to Apples
Removing price from the chart, we can marvel at how far we’ve come in improving the momentum indicator:
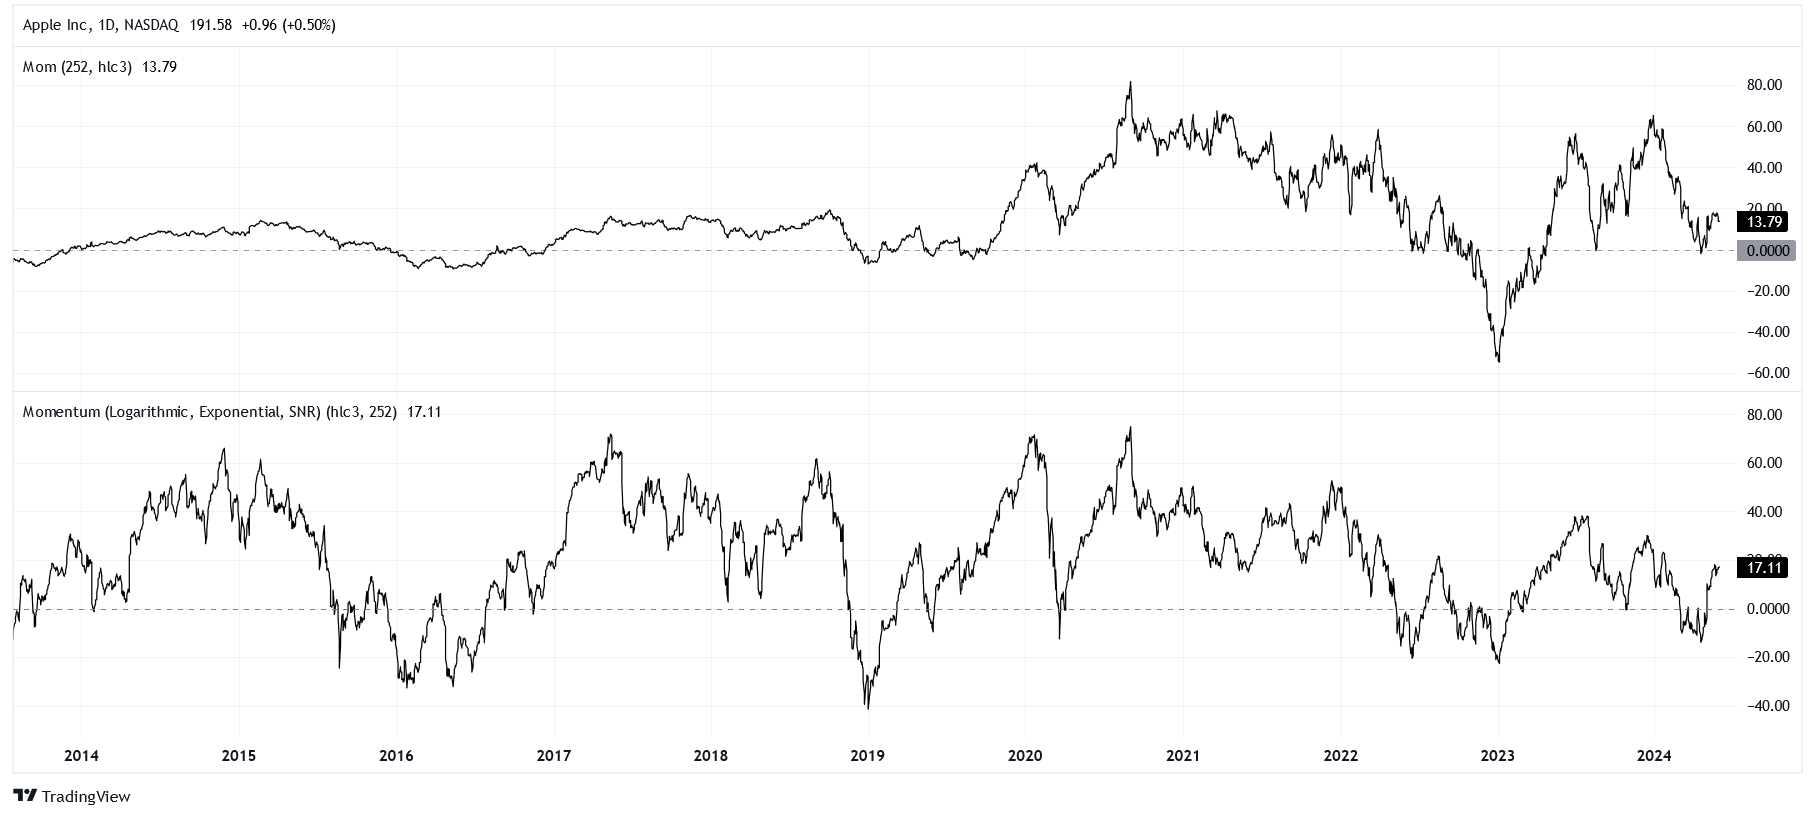
Looks better, doesn’t it?
Conclusion
We will never find the perfect indicator, and that’s okay. It’s more important to be able to think and reason about how and why an indicator is giving us the values it does.
A ratio and a difference both tell us about change, but in different ways. Percent change and log change are related, but their differences are essential to understand. Simple and exponential moving averages can both summarize a period of values, but in very different ways!
These differences, and the nature to their mathematics, are immensely important. We want to be accurate. More that that, we want to understand. When we understand the bones of an indicator, only then do we really understand what it’s telling us.