

Low Clearance
Watch your head.

In today’s article, we examine a colossal trendline.
Bubble Territory
The two largest bubbles in the American stock market were the Roaring Twenties (1920s) and the Dotcom bubble (late 1990s). In 1929, the S&P 500 cash index (SPX) reached an all-time high (ATH) of $31.86 and would later reach another ATH of $1552.87 in 2000. We can refer to these points as the “bubble highs.”
Given two points, we can draw a line! Let’s see what that looks like on a log-scaled chart:
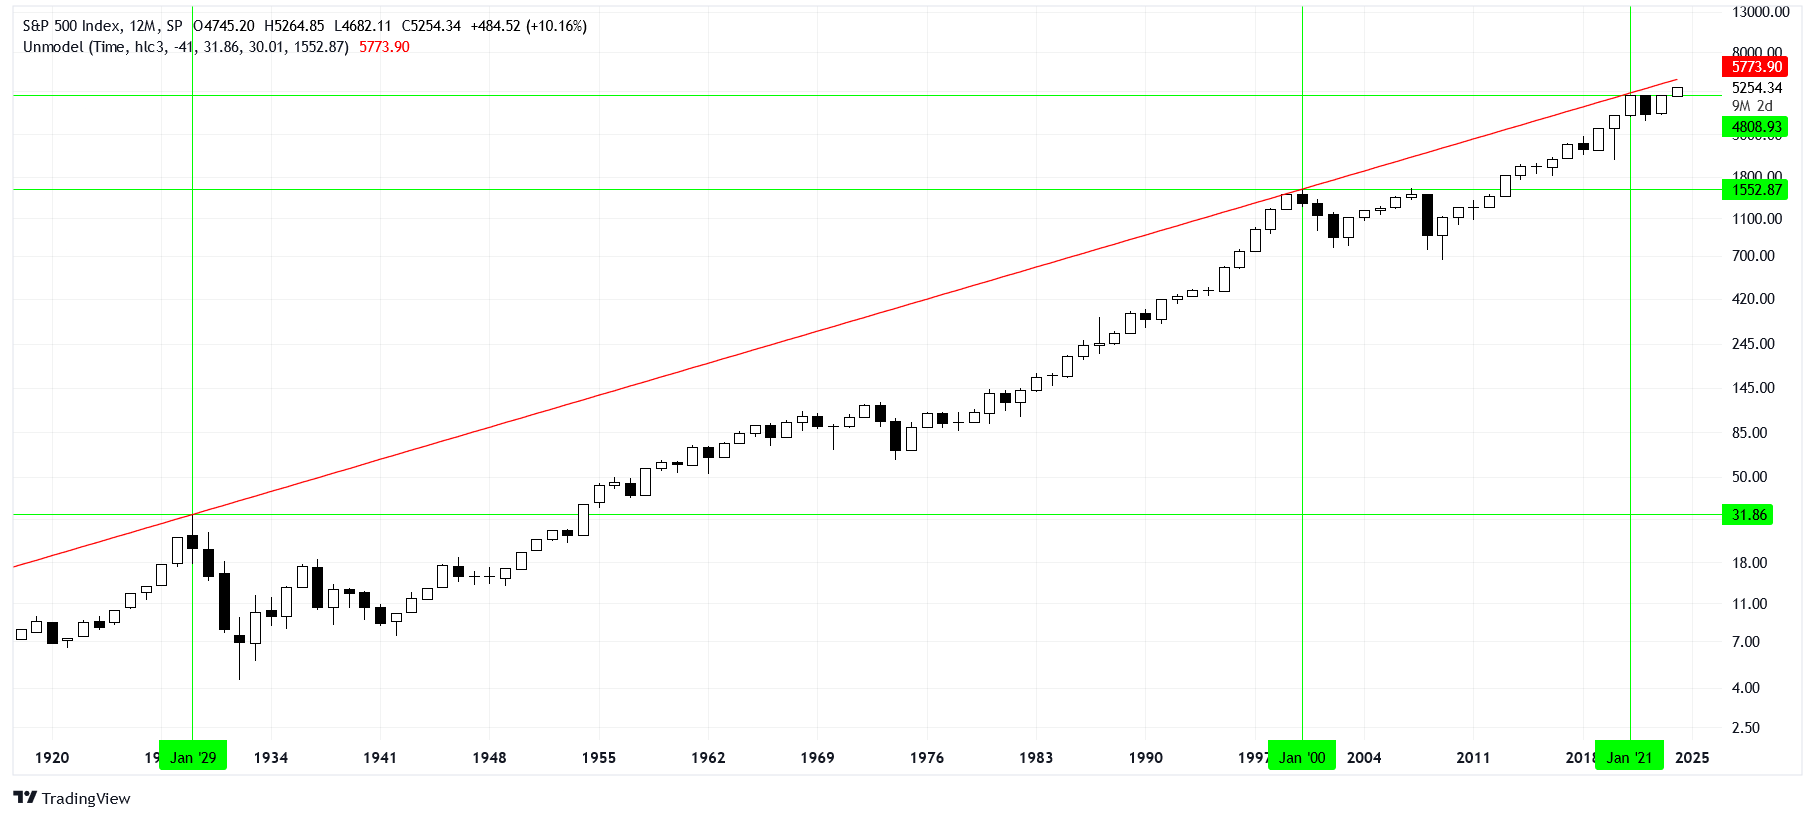
Notice that the mini-bubble of 2021 kissed this trendline perfectly. It came within 2% of what we would have expected for a new ATH. This is a little easier to tell if we look at the spread between the high and this trendline:
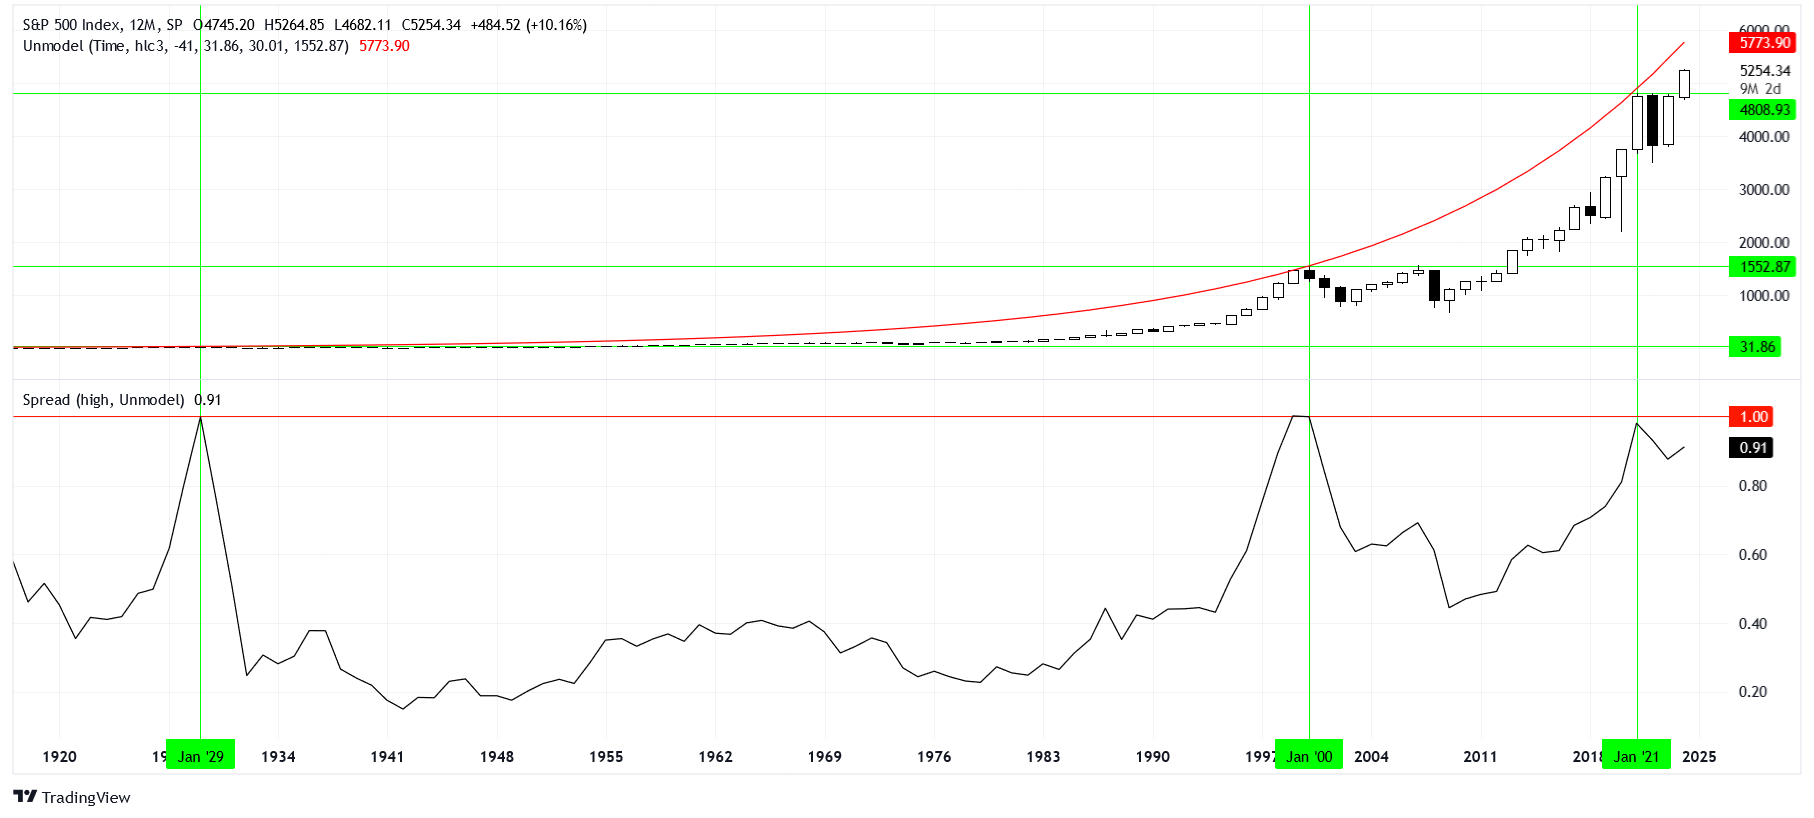
Notice we’re plotting the trendline as it appears on a linear view in the top chart. Using the spread view below, we can see that we have done nothing but creep back up to “bubble territory” since 2009. Even after the 2022 correction, we are back to within 9% of this trendline. Currently, the predicted ceiling is for 2024 is $5773.90.
Conclusion
The two largest bubbles in American stock market history are telling us that we are quite near the ceiling of expected returns for equities. This trendline is not a magic bullet; it could be broken, but so far, it has been respected.
How far do you want to push it?