May 2024
April showered, will May bring flowers?
In this month’s update, we look at the volatility experienced by U.S. equity markets, especially the Dow Jones Industrial Average, and consider a stock pick.
April in Review
While reviewing markets is enjoyable, especially to see for ourselves what markets are changing, going through each issue by hand is becoming tedious.
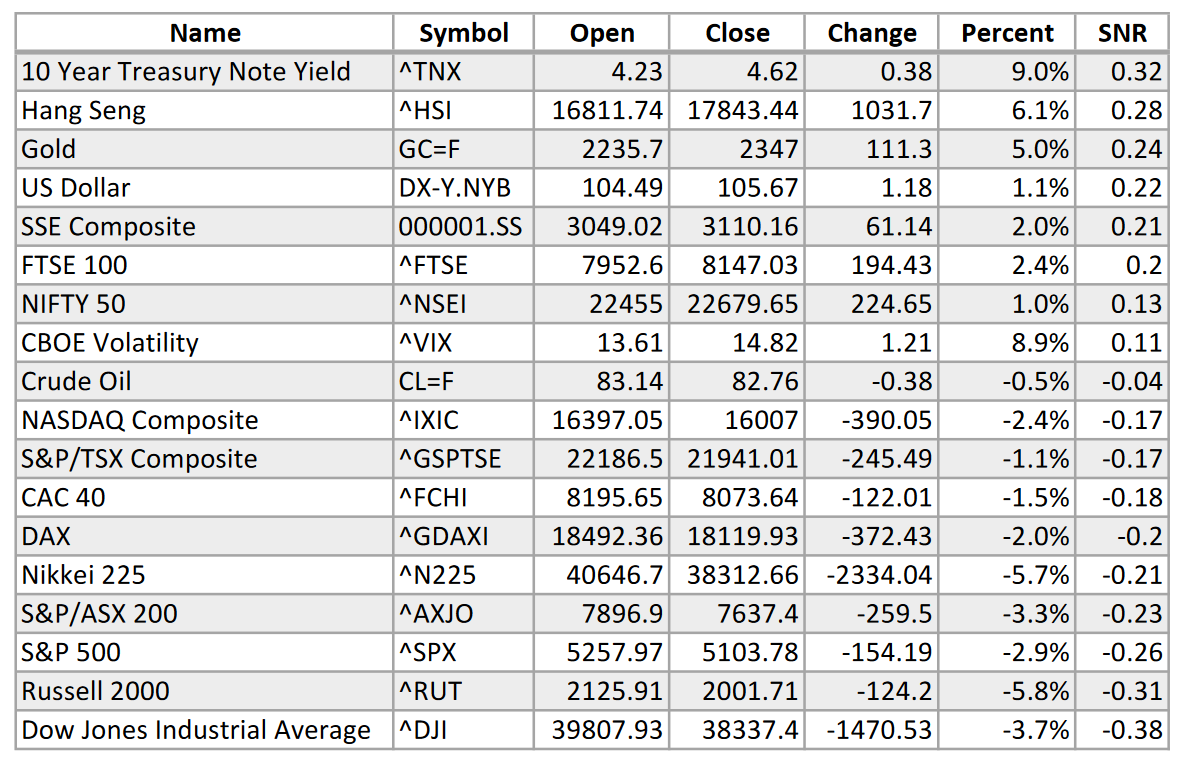
Because of this, I have started automating the process. For now, I only have the “typical” assets that I like to review at the top of each monthly. Later, the automation can be extended to, say, the entire S&P 500 index.

The above data table is sorted by the signal-to-noise ratio calculated on daily log changes within April for each issue. This is not perfect, but it works reasonably well. Special attention should be given to issues that do not report in absolute values, like the 10-year Treasury note yield (TNX) and the CBOE volatility index (VIX). A percent change from a value that is already a percentage is not technically valid. We can be lazy for now and sweep those details under the rug.
Boring stuff aside, what’s moving? Interest rates are up, Chinese equities are up, gold is up, and the dollar is up. Some assets like crude oil barely moved. On the downside, we have two large American equity indexes, the Russell 2000 (RUT) and the Dow Jones Industrial Average (DJI).
We should look at the Dow more closely.
The Dow Is a Dog
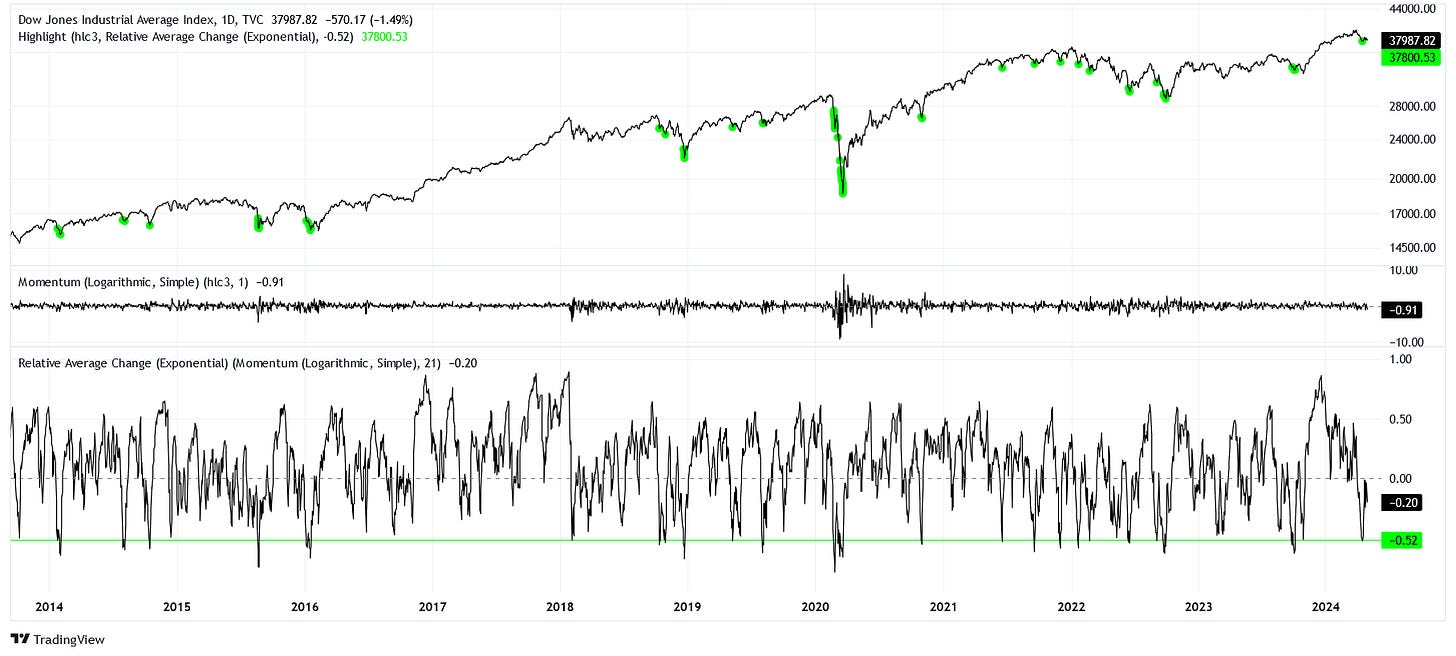
The DJI had a historically poor month. April 17th seems to be the worst day so far, based on a monthly exponential signal-to-noise ratio indicator (a reading of -0.52 means that 52% of the total movement was realized to the downside).
Check out the details below.

The above chart has about a decade of history within view. Given this history, we can highlight other times where our indicator is telling us recent movements have been very bearish. Those green highlights typically denote at least a local bottom, if not an absolute trough on a higher timeframe. Early 2020 sticks out like a sore thumb as the exception to this rule.
We must be brave and consider that the majority of signals in the chart above indicate that right now is an ordinary dip and not the start of a crash. Yes, the market is positioned too long here. Yes, the valuation of American equities is ridiculous. But nothing happens overnight. The unwind will take time.
For now, close your eyes and buy.
We Need More Intel
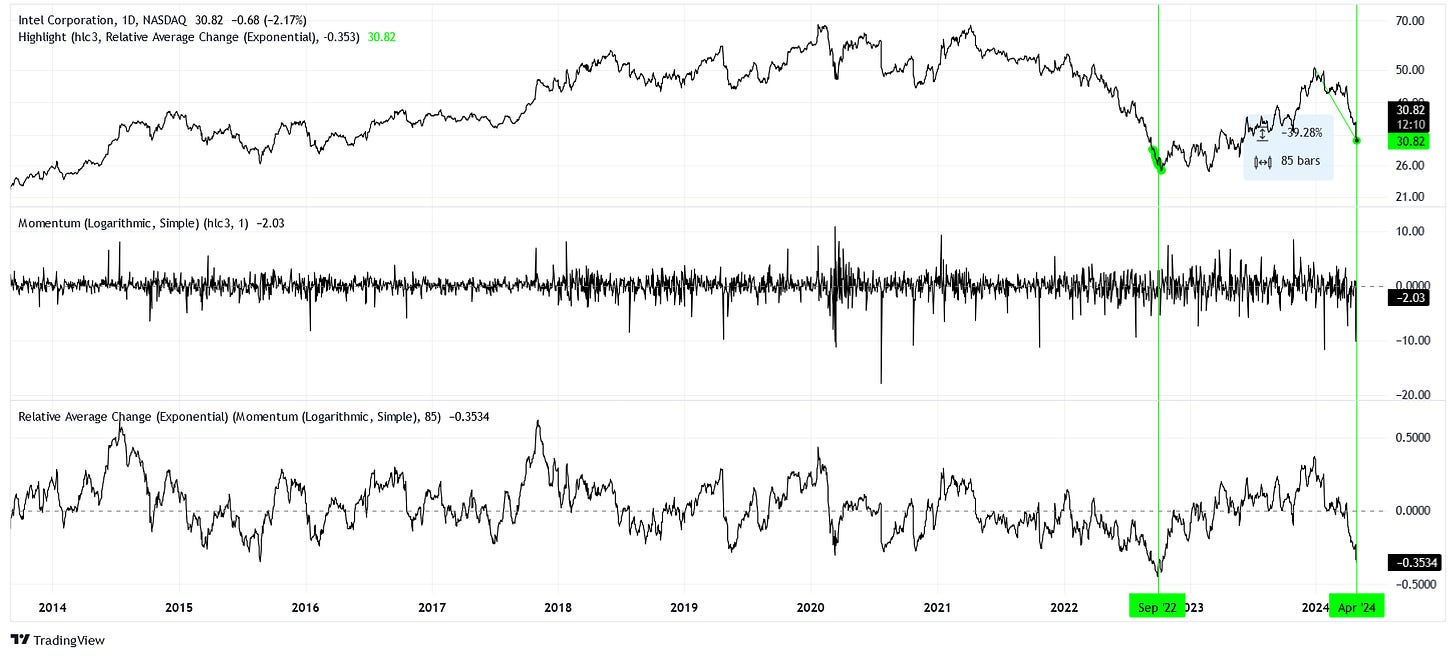
One chart that stuck out to me this month is Intel Corporation (INTC). In the past four months, it’s lost over 39% of its value. Using the same method as the section above, we can look for similar bearish periods in Intel’s history.

Only September 2022 had a four-month trend as bearish as the one we see today for the past decade. In October 2022, INTC would bottom out close to $25. The bottoming process took a few months, but eventually, the stock ran up to $50 by December 2023, doubling the price in a little over a year.
Those returns are nearly impossible because you would have to perfectly pick the bottom and the top. If we look instead at a couple of pivots that price touched multiple times, $27.50 and $45.00, we could have realistically realized a 64% return.
Perhaps we should think about it this way. With adjustments for splits (but not dividends), INTC traded at this same price for the first time all the way back in 1998.
INTC has problems, yes, but for a large company and a household name, I think the bearishness is a little overdone here.
Disclaimer
The content provided is for informational and educational purposes. It is not financial advice. You are solely responsible for your investment decisions. The author assumes no liability for losses or damages resulting from decisions based on the content provided.


