

Quiet
Big names, low turnover.

In this week’s article, we turn down the volume.
Turnover
Simply put, turnover is the ratio between a given trading day’s volume and the total shares outstanding for a stock. This ratio can be smoothed with a moving average to make trends more apparent and easier to analyze.
When a stock has low turnover, it means that few people are trading the issue at that time. Conversely, high turnover indicates increased activity surrounding the stock. We can think of “quiet” and “loud” as good analogies for low and high turnover, respectively.
How does this help us trade? This part is a little more complex. High turnover, when a stock has been beaten down, is typically a sign of capitulation, where weak hands sell to stronger hands at a discount. Low turnover is more complicated; it can be a healthy sign if the price consolidates and then resumes an upward trend. However, it can also indicate weakness if the price is in its distribution phase, where strong hands sell to weaker hands at a premium.
Quiet as a Mouse
Using TradingView, we can request data on the daily volumes and total shares outstanding (TSO) for the ten largest public U.S. companies. We will sum each variable across all companies and then find the ratio between the summed volume and the summed TSO to establish a proxy for “market turnover.” While ten stocks are a small sample, they are the largest companies in a highly concentrated market, so the result should be fairly accurate.
Let’s plot what we found, highlighting certain levels of turnover on the S&P 500 cash index (SPX) alongside it.
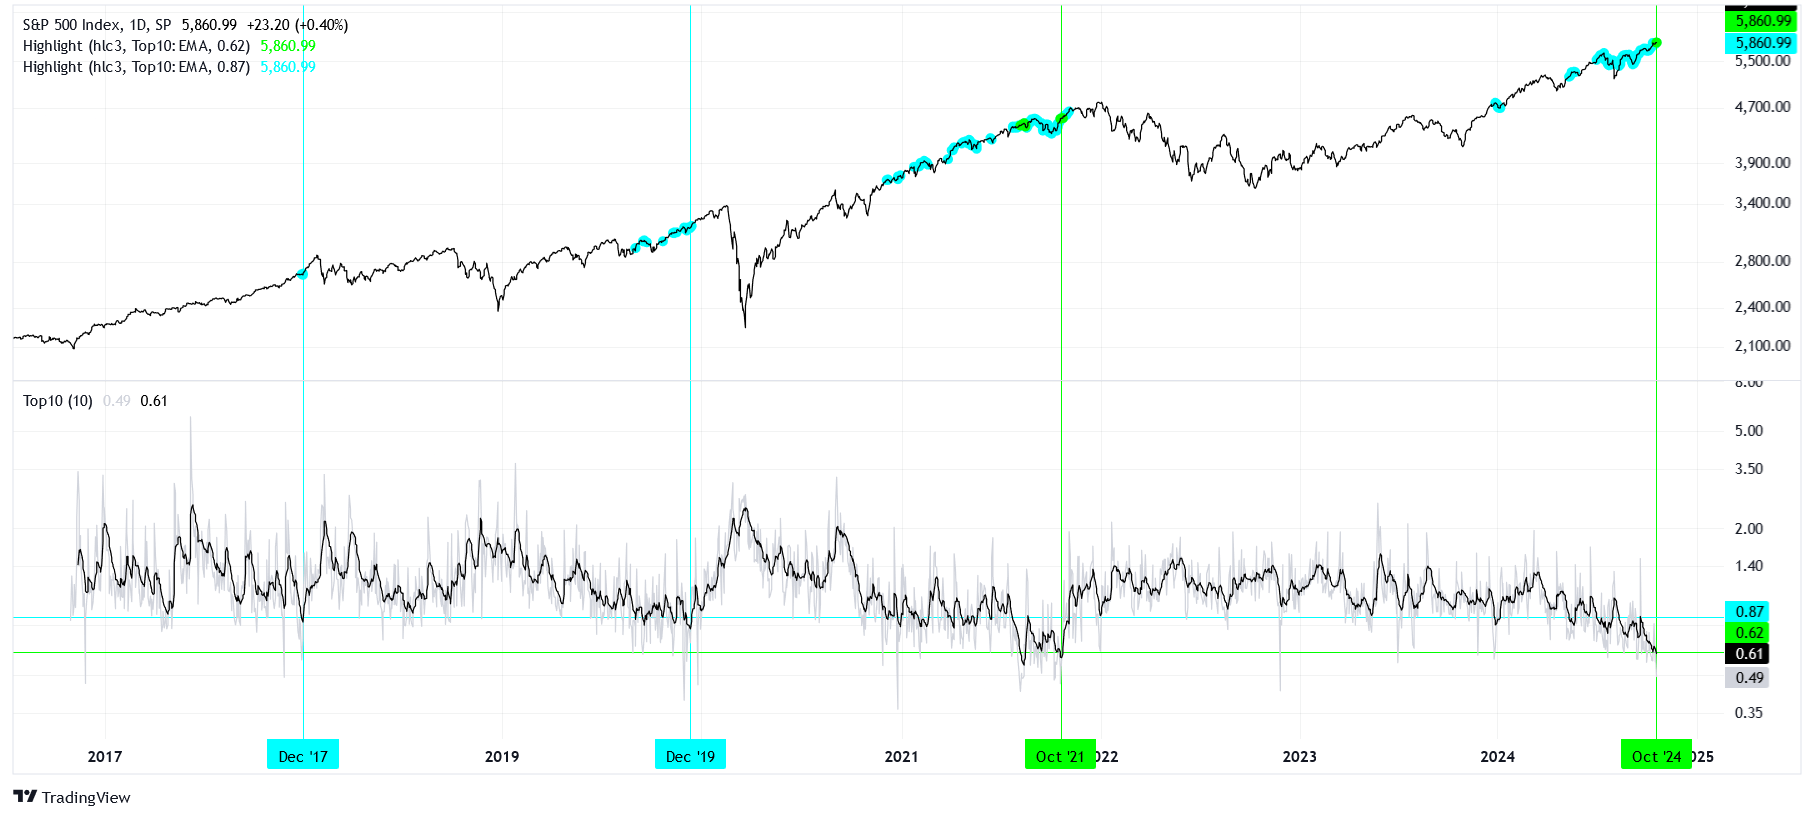
Using the exponential moving average (EMA) of turnover, smoothed over 10 periods, we see that the current value is 0.61%. This means that, on average, 0.61% of a stock’s total shares are traded as volume in a day. The only other periods with such low turnover occurred at the end of 2021, specifically in August and October.
While turnover is rarely this muted, we can also highlight quiet periods below the 0.87% level, such as December 2017 and December 2019. It’s interesting that these periods are all near the end of the year, and for 2017, 2019, and 2021, they are spaced two years apart.
Notice that after all these “quiet times,” turnover eventually picks back up, sometimes dramatically, and that typically the price of the SPX suffers.
In contrast, consider that the 10-period EMA of turnover during March 2020 was 2.42%, or roughly four times higher than it is now! When the market goes south, it becomes active.
Keep this in mind.