

"See Oh Tee"
Commitments of Traders

In this week’s article, we get interactive with positioning data.
Tool Around
This past week, I was delighted to stumble upon an interactive tool hosted on the CME Group’s website. It allows users to explore various datasets provided by the Commodity Futures Trading Commission (CFTC) in its weekly Commitments of Traders (COT) report.
I highly recommend clicking the link above and trying it for yourself.
“What’s so special about this report?” you might ask. Well, dear reader, it tells us how many contracts are long or short across a myriad of futures and options products. It also provides insights into which categories of traders hold these positions.
If this still sounds vague, there’s a reason for it. Futures and options products are diverse—you can trade them on stocks, bonds, commodities, and currencies!
For example, here’s the combined futures and options positioning for gold:
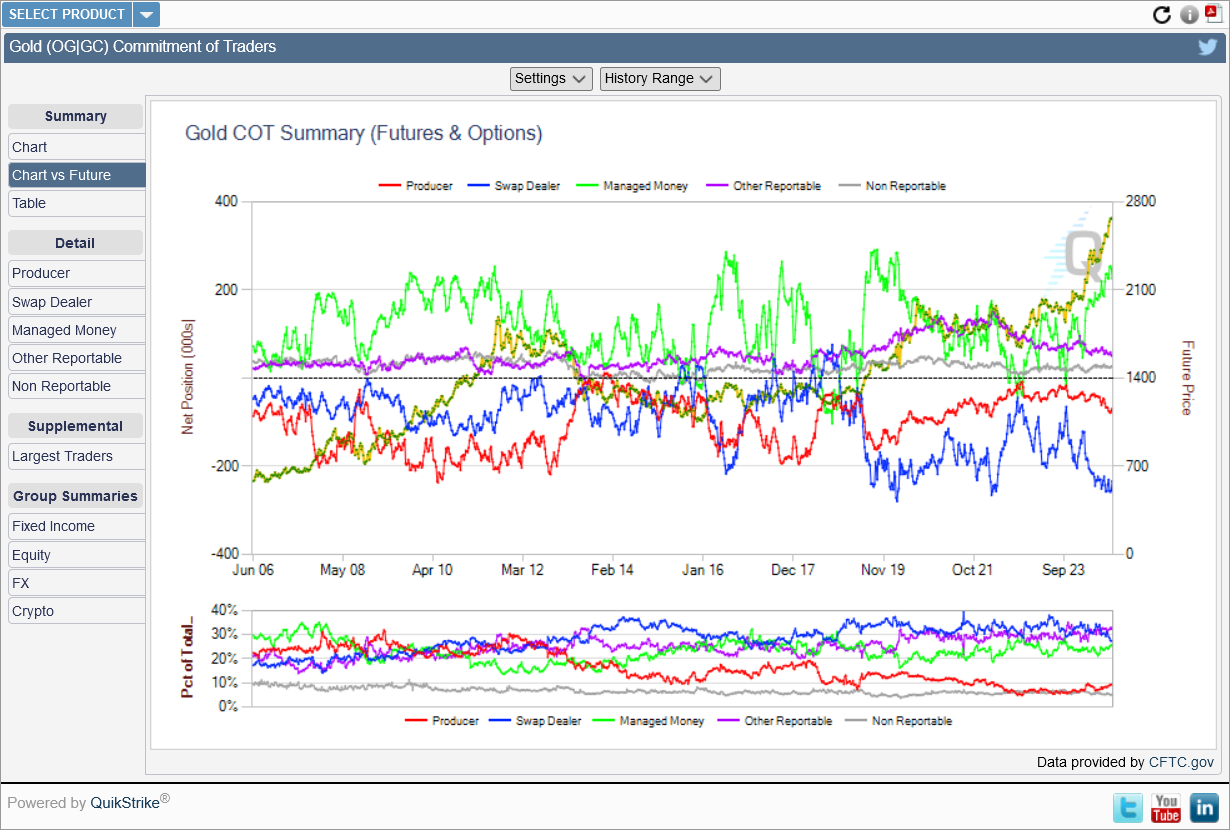
Notice how the tool breaks down trader classifications into producer, swap dealer, managed money, other reportable, and non-reportable. It appears that managed money traders are the most long in their net position, while swap dealers are the most short on their net position.
What I aim to do with this kind of data is to find groups that disagree with one another and pit them against each other to see which group is more accurate. I don’t think it’s much of a spoiler for me to tell you that dealers often come out on top.
For example, if we take the difference between the net position of managed money traders and the net position of swap dealers, we get the following:
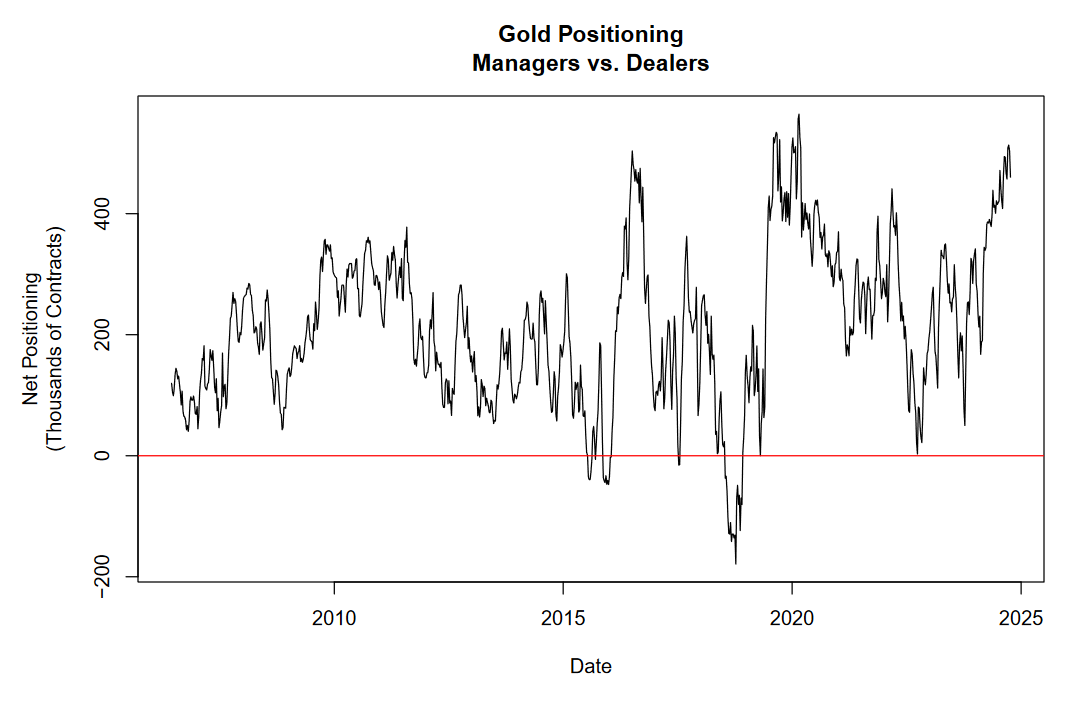
Now, I don’t want to suggest that dealers always win and managers always lose—that’s simply not true. However, it’s fair to say that dealers tend to outperform, while managers are often suboptimal.
Gold is interesting, but here on this blog, we focus on stocks. So, let’s take a look at how U.S. equity index positioning has changed since we last reviewed it.
Equity Derivatives Net Exposure
On the interactive tool, there’s a useful sidebar for “Group Summaries.” One of these is simply labeled “Equity,” and it refers to the net position for combined futures and options contracts across the S&P 500 E-mini, NASDAQ 100 E-mini, and Russell 2000 E-mini futures products.
Here’s what it looks like:
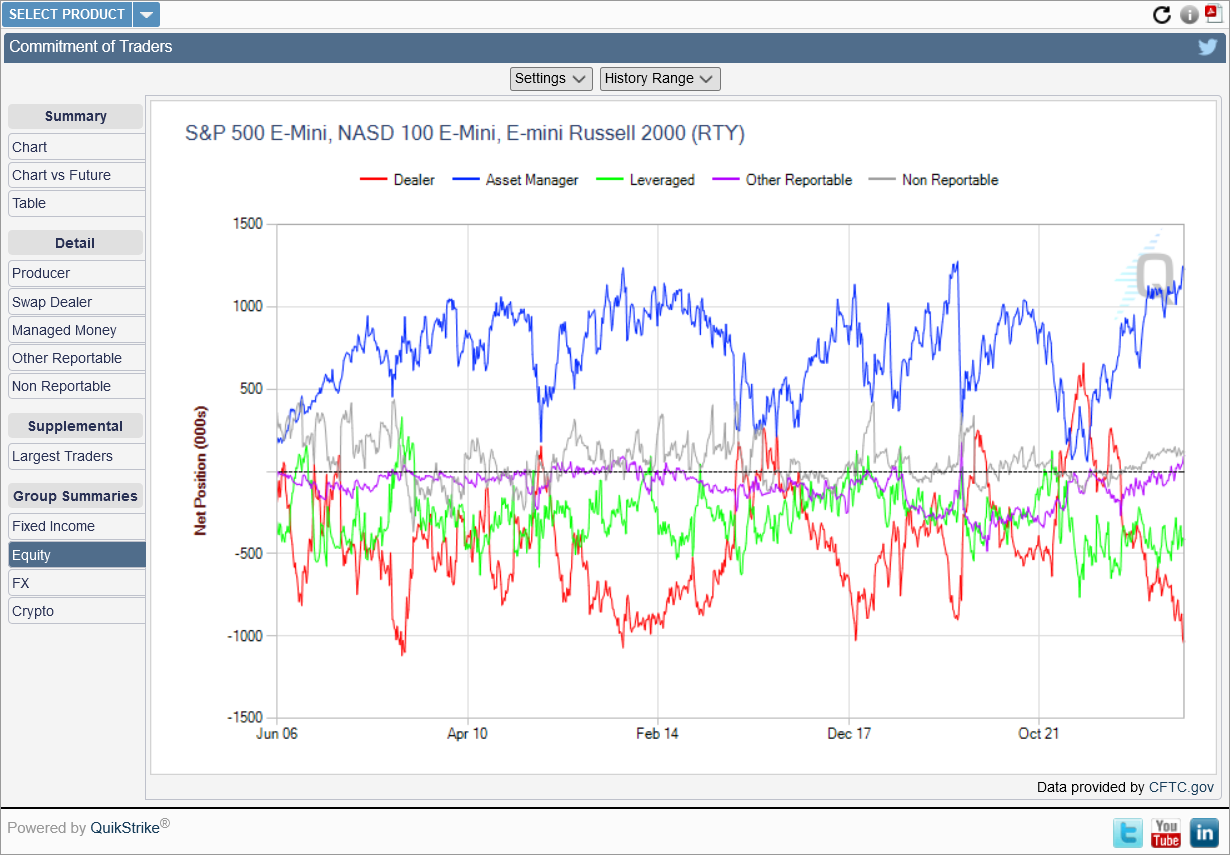
Just like with gold, we see that dealers and asset managers are at odds in their net positioning. Managers are the most net long, while dealers are the most net short.
If we once again take the difference between manager and dealer net positions, we get the following:

This is the chart that keeps me up at night.
Managers are heavily long here, while dealers are quite short. It’s the most dramatic shift in positioning in such a short time within this series. The “dumb money” went from being extremely net short in 2022 to extremely net long in just a couple of years.
Who would you bet on? The house or the gamblers?