

September 2024
Let the games begin.

In this month’s market review, we reflect on a volatile August.
Bomb Squad
Before we get to our common asset review, let’s take a look at the CBOE Volatility Index (VIX) against a host of relevant series.
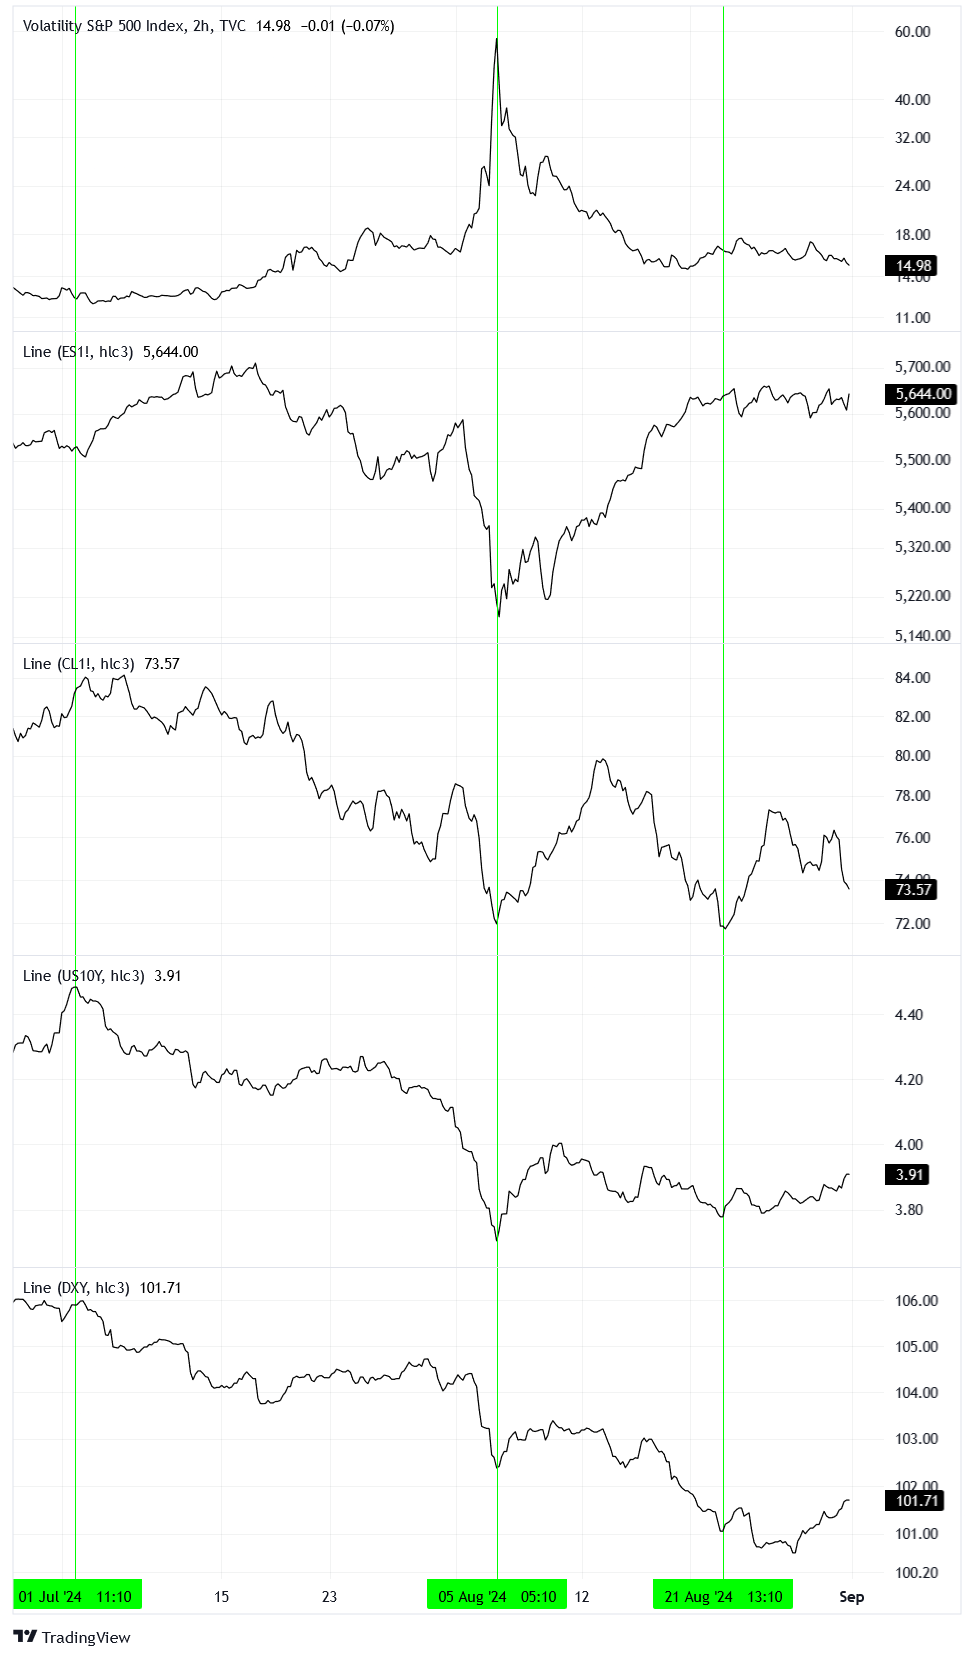
What do you notice?
As volatility exploded the equity market dropped, crude oil prices moved down, long-dated bond yields fell, and the dollar weakened. While volatility has subsided and equity pricing healed in the aftermath, oil, yields, and the dollar all remain weak.
In summary, while the equity market has largely papered over the explosion in volatility that we experienced in early August 2024, other markets indicate an enduring fear of a weakening economy.
August in Review
Enough nostalgia, let’s digest!
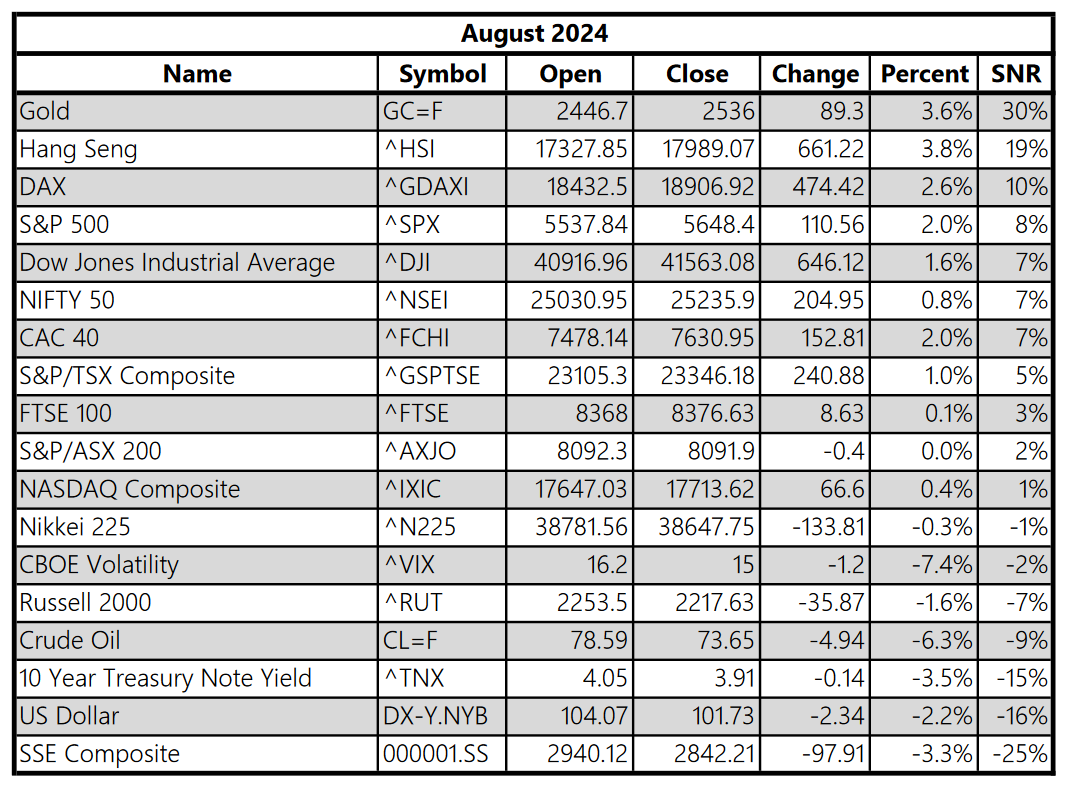
Gold had the most definitive move up, likely due to investors seeking safety in a turbulent market. This idea is reinforced by the 10-year Treasury note yield definitively moving down. Weak oil pricing and a weak dollar may signify fears of a deflationary recession heading for the United States.
Strangely, the Hang Seng index (Hong Kong) rose significantly, but the SSE Composite (Shanghai) fell significantly. What it means when different Chinese exchanges are at odds with one another, I wish I knew. Perhaps it’s not so different than the Russell 2000 disagreeing with the S&P 500 index, which also happened! Small caps moved down at the same time large caps moved up.
Generally, other equity indexes remained fairly slothful, not moving much since July.
Picker’s Criteria
Looking back on last month’s review, I am not happy with the poor quality of issues highlighted by the automated shortlist of stocks to watch in the Wilshire 5000. Unfortunately, because there were so many stocks, we found a lot of volatile and illiquid names that are likely not worth playing around with.
Counterintuitively, we have to slim our universe of stocks down to something sensible once again. But how should we do that?
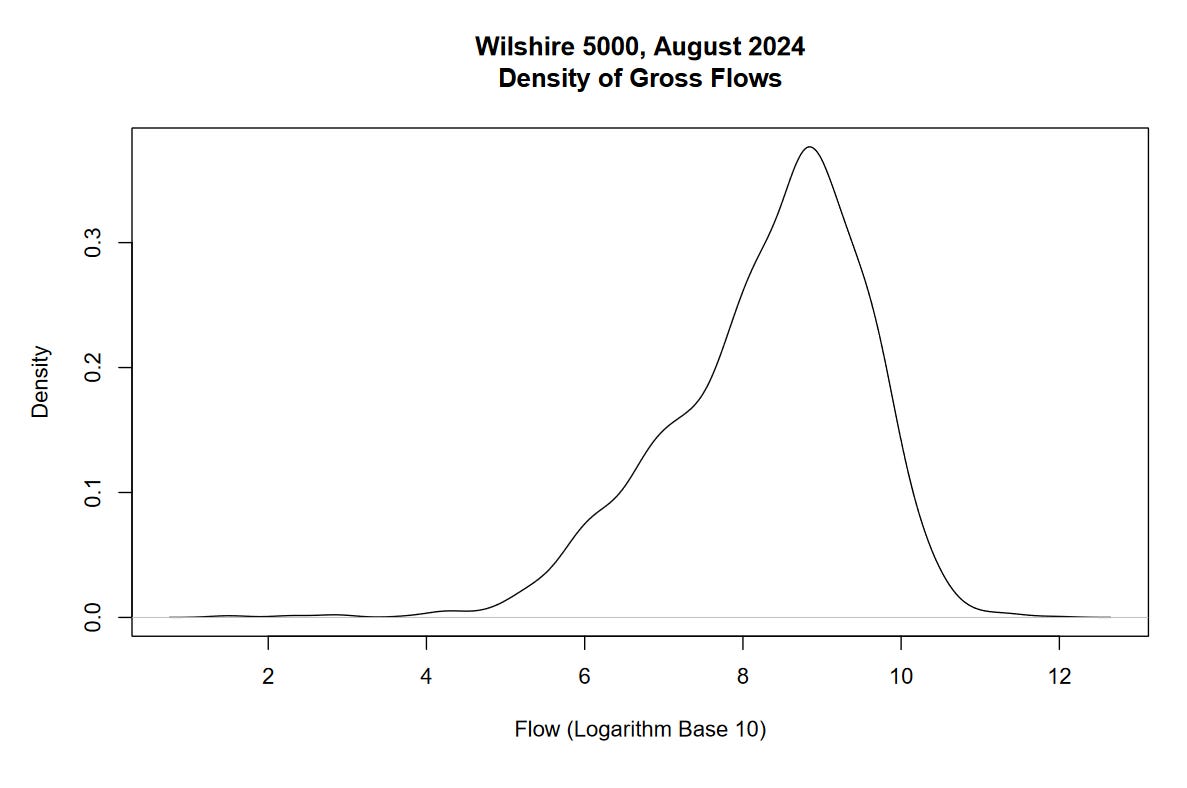
We can use gross flow to evaluate the relevance of a stock. Simply take the close price for each day, multiply it with that day’s volume, and sum all the products for the month. This is roughly how much money moved through the stock in that month. For example, my script calculated that NVIDIA (NVDA) flowed $939,195,802,782 in August. Almost a trillion dollars flowed through a single stock this past month!
To read the above graph, we take the base 10 logarithm of the gross flow, so 11.97 for NVDA, and then create a density plot for all the companies in our universe (for us, this is 2,530 stocks). Notice that the median (highest point of the curve) falls a little bit below 9, meaning that most stocks flowed around a billion dollars last month.
To keep things simple, we’ll just filter our universe up from the median gross flow.
Movers and Shakers
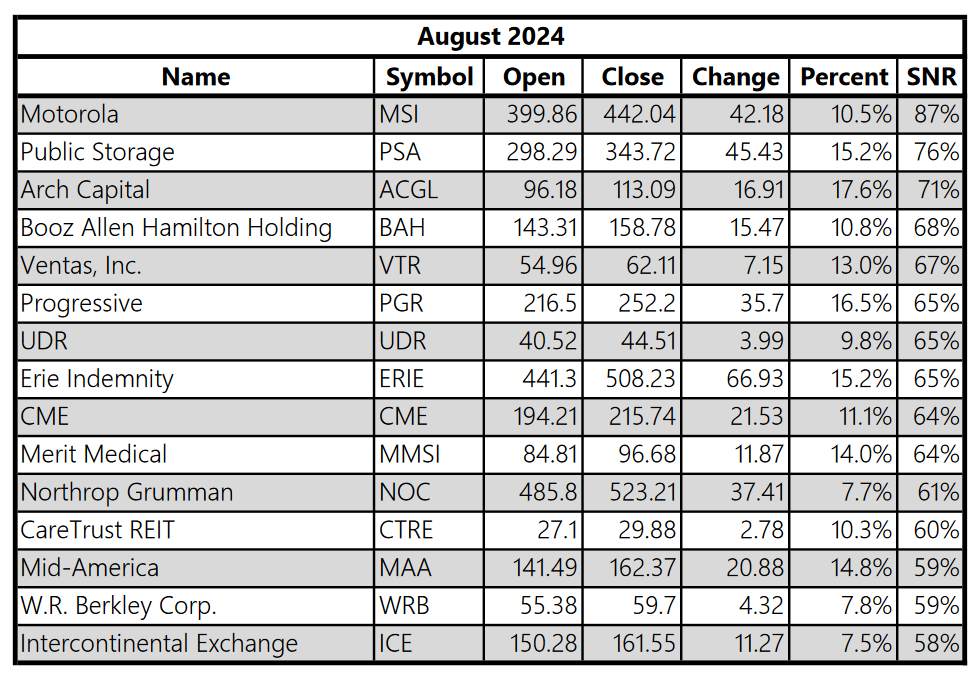
High SNR first, the definitive up moves.
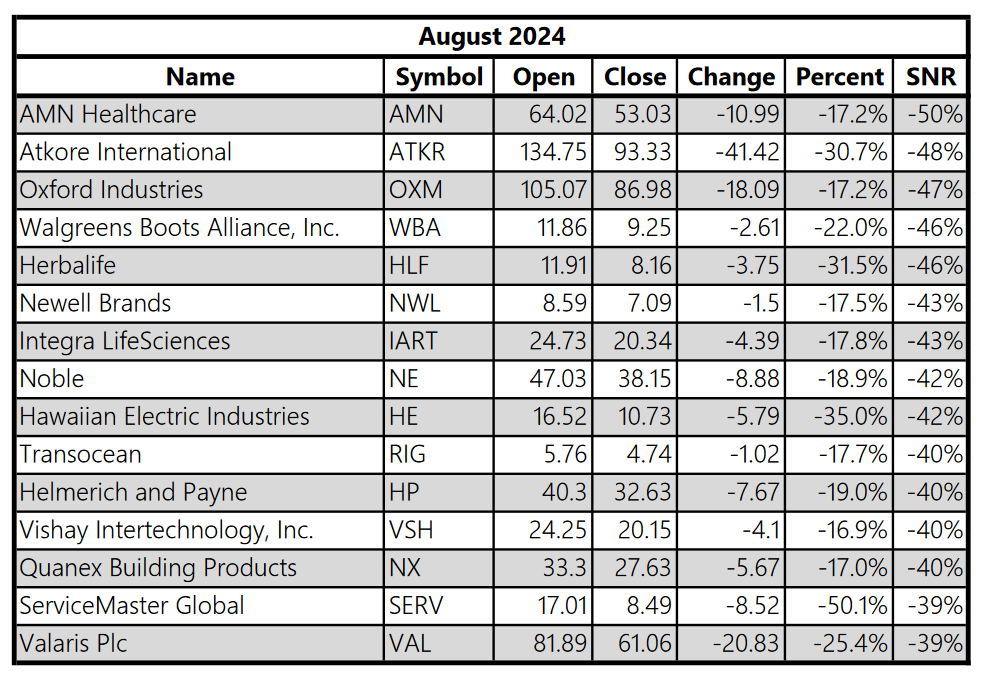
Now for low SNR, definitive down moves.
I’m afraid I can’t give much commentary, Substack is alerting me that the post is almost too long for the email newsletter. These issues seem to be more relevant than last month, which is wonderful.
I encourage you to dig around the charts of these names, you might find a gem!