

Signal to Noise
Separating wheat from chaff.

In today’s article, we will learn about a method to standardize returns by volatility and examine our current situation.
Preamble
This article will be somewhat “mathy.” If that’s not your cup of tea, feel free to skip ahead and read the conclusion in the last section!
Mean
The mean is a measure of central tendency.
Most people are familiar with the “arithmetic mean,” which is the sum of a set of numbers divided by the size of the set. This is also what most people refer to when they talk about the “average.”
Standard Deviation
Standard deviation (SD) is a measure of dispersion, specifically around the mean.
Calculating SD involves a bit more math. First, you find the difference between each number in a set and the mean of the set. These differences are called deviations. Next, square each deviation and then sum them all together. Divide the sum of squared deviations by the size of the set to get the variance. The square root of the variance gives you the SD.
You can visualize SD as a measured “step” away from the mean. One step in either direction (plus or minus one SD) encompasses about 68% of the data in a normal distribution. Two steps capture around 95% of the data, and three steps cover approximately 99.7% of the data. This pattern theoretically continues indefinitely.
Coefficient of Variation
The coefficient of variation (CV) is the SD divided by the mean.
CV makes the SD relative to the magnitude of your original data. For instance, if the mean is 10 and the SD is 5, the CV would be 0.5. If the mean is 100 and the SD is 50, the CV remains 0.5.
Signal to Noise Ratio
The signal-to-noise ratio (SNR) is the inverse of the CV.
SNR makes the mean relative to the magnitude of your original data. Using the examples above, if the mean is 10 and the SD is 5, the SNR is 2. Similarly, if the mean is 100 and the SD is 50, the SNR remains 2.
This Juice is Too Sweet
Taking a snippet of time, there was a 100-day trading rally between October 2023 and March 2024 that resulted in +27.1% gains in the S&P 500 cash index (SPX). This rally showed very low variance, essentially representing a straight line up. When we calculate the SNR for the daily returns during this rally, it comes in at 40.4.
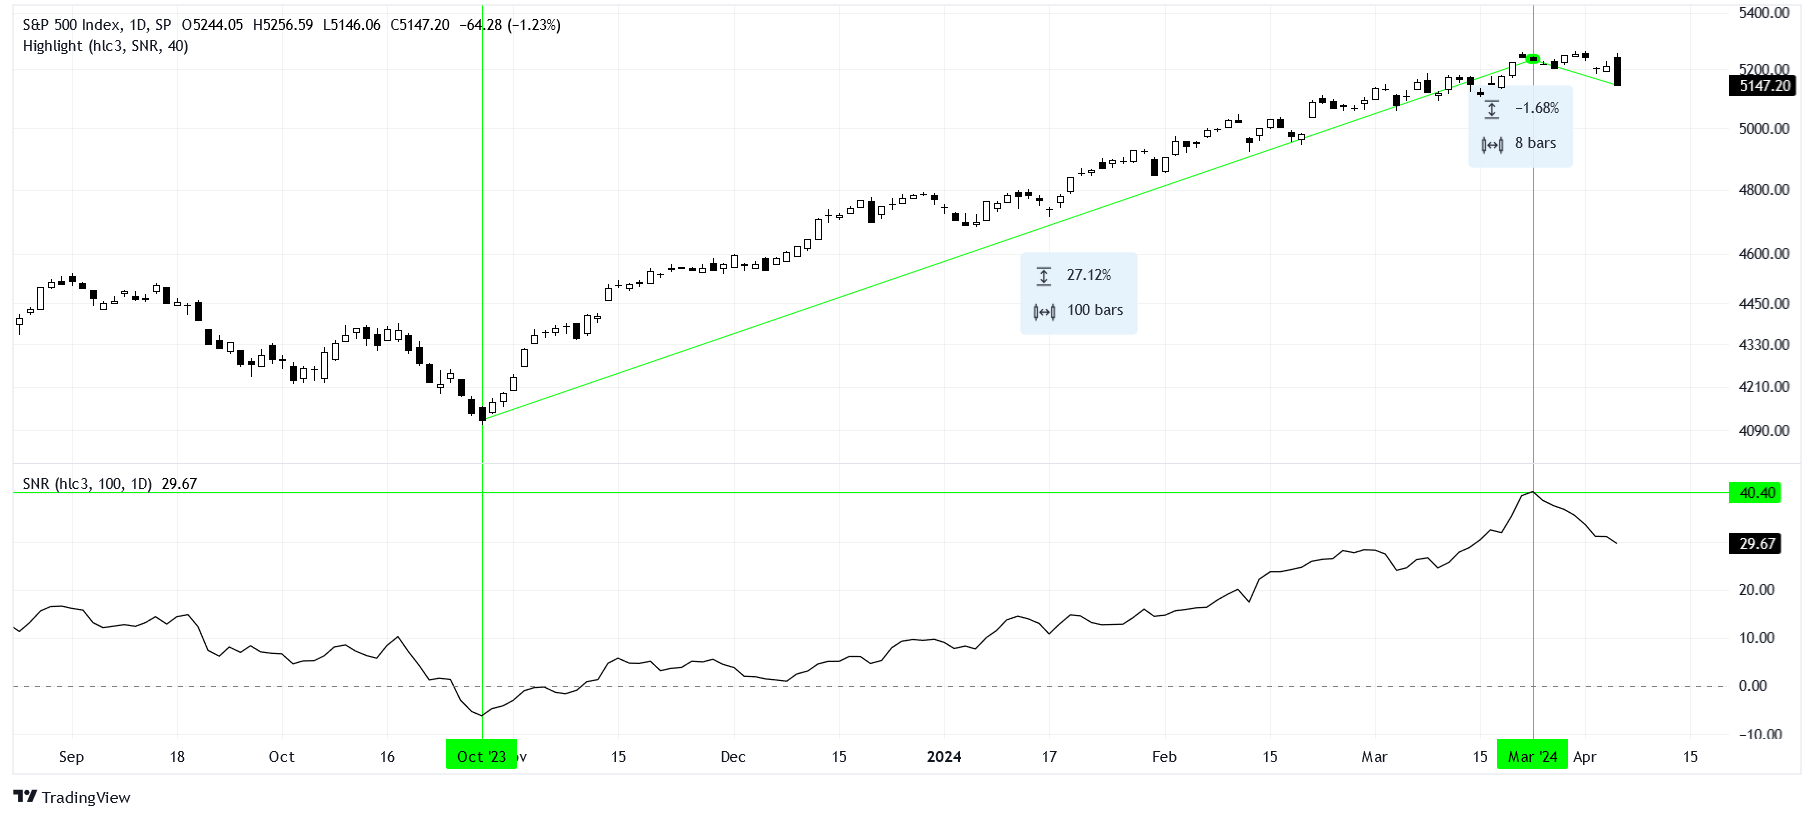
Experiencing a rally of this duration with an SNR of 40.4 or higher is quite rare! Similar instances occurred in January 2018, followed by an -11.7% correction within 9 days. Another case happened in May 1995, where although there were no significant corrections, the upward trend became notably bumpier. In April 1971, there was a 51-day correction of -5.5% following such a rally. Lastly, in April 1964, there was a -2.3% correction over 32 days. It’s important to note that all these timeframes mentioned are in trading days, not calendar days.
Considering this historical data, we should anticipate a lower SNR in the near future, likely accompanied by increased volatility and possibly a correction.