

Time in the Market
Does it beat timing the market?

In today's issue, we explore the difference between short-duration and long-duration trades and investments.
For the Many, Not the Few
A common financial adage is that “time in the markets beats timing the markets.” This holds true for 95% of market participants, but why exactly? And what about the other 5%?
To investigate this adage, we examine returns on the S&P 500 cash index (SPX) using two different durations. However, some preamble is required. I use log change instead of percentage change, making the data more normal. It is still not entirely normal, so I employ Johnson's SU-distribution, which accounts for skew (asymmetric tails) and kurtosis (curve "flatness") to model the curves.
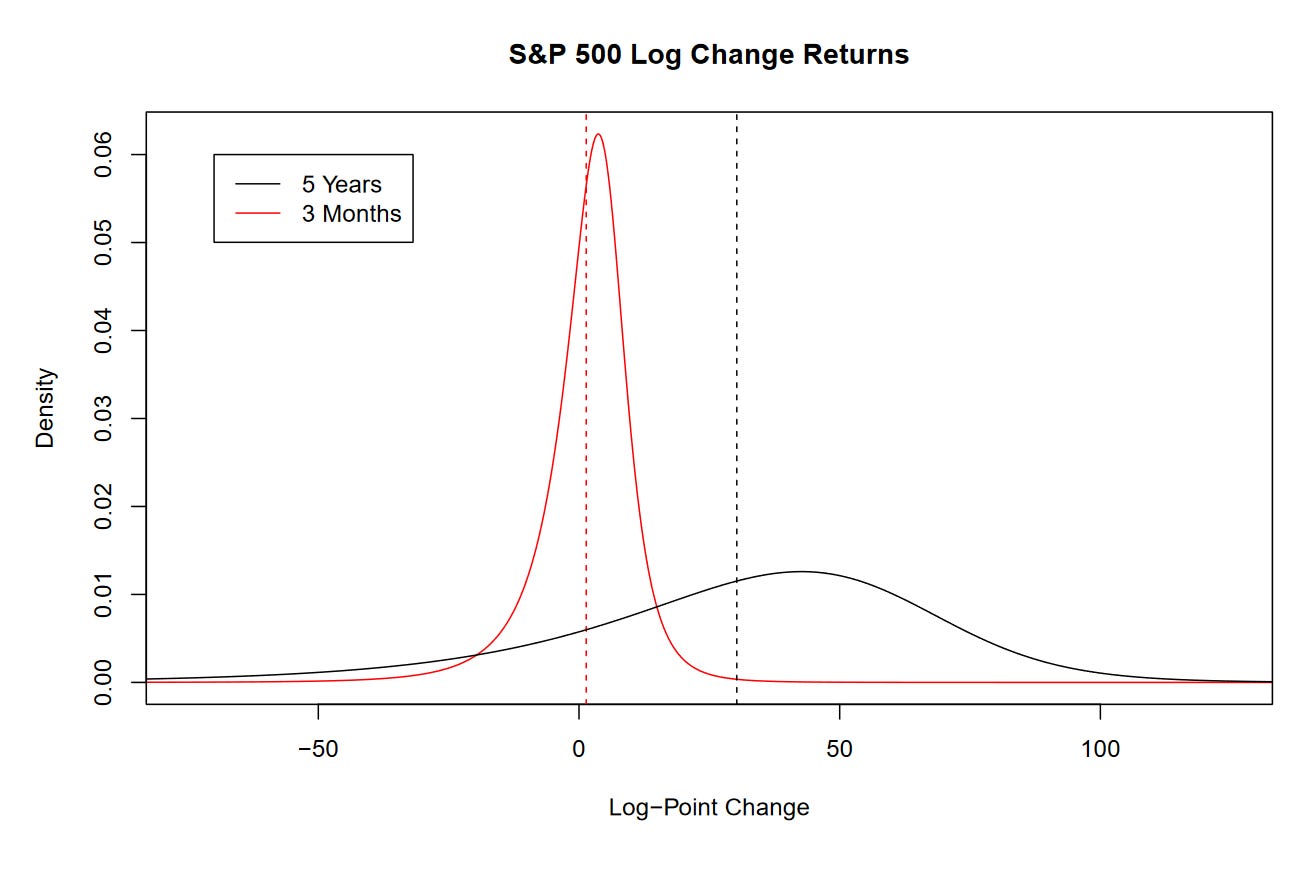
In the plot above, we observe two curves. The red curve represents the returns over a three-month duration, while the black curve shows the five-year returns. Imagine that five years represent more “time in the market” compared to “timing the market” every three months. The three-month returns are concentrated close to zero, while the black curve is flatter and peaks further into positive returns. It is easy to see that a large chunk of the five-year distribution has better returns than the three-month distribution.
The dotted lines represent their respective means. The mean three-month return is 1.5%, and the mean five-year return is 35.2%. It is important to note that the mean three-month return compounded to five years is equivalent to 34.7%. The discrepancy in mean returns is minor with proper adjustment.
However, there are discrepancies that cannot be resolved. For example, 36.5% of returns are negative after three months, but only 20.1% of returns are negative after five years. This means that the chance of lost principal is 1.73x higher on a three-month trade than on a five-year trade.
This is reflected in differences in volatility. After three months, there is a standard deviation of 10.1%. After five years, there is a standard deviation of 46.8%. We can adjust the mean returns using their standard deviations (inverse coefficient of variation) to get ratios of 0.146 for three months and 0.752 for five years. Essentially, this means that five-year returns have a 5.15x higher return-to-volatility ratio when compared to three months.
This is the essence of why trading higher timeframes is easier. There is more certainty of a positive return! For greenhorns and non-professionals, the advice to buy for the long-term makes a lot of sense.
For the Few
Long timeframes are not the only game in town.
At the extreme short duration, high-frequency trading firms represent the minority of institutions but the majority of trading volume. These firms measure trades not in seconds but in the millionth of a second. We humans should not try to compete on these timeframes, but that does not exclude us from trading a little more often.
How does the game change at shorter durations? First, let us consider the long-term view once again.
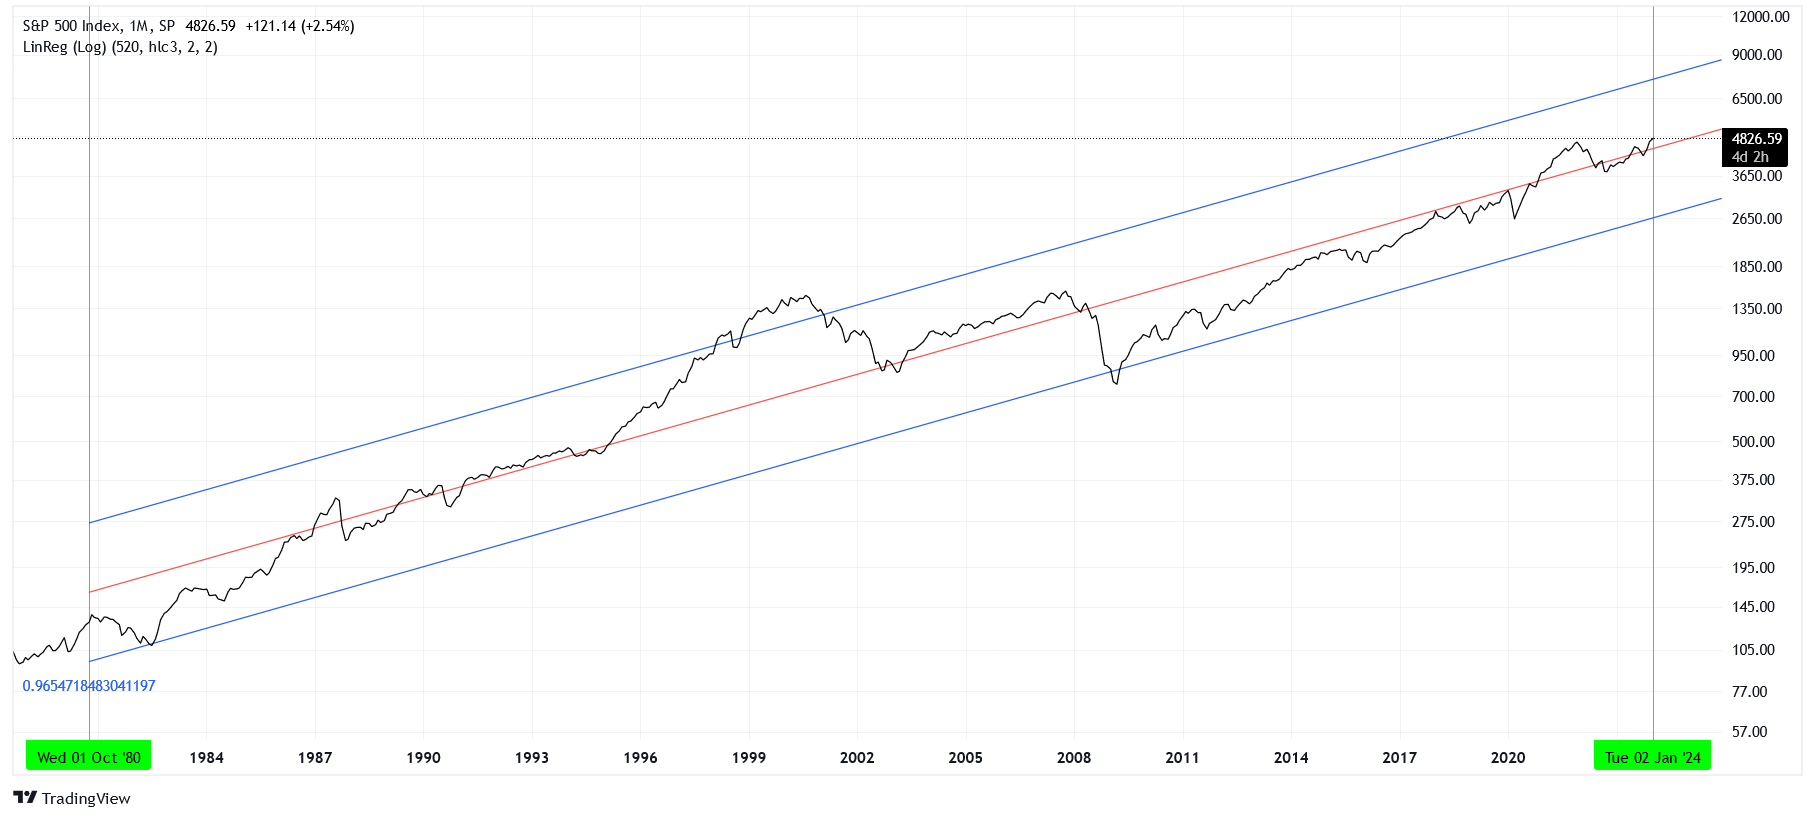
If we look at the last 520 months on the SPX, we can fit a log-linear regression model to the data with an R-squared value of 93.1%. This means that a straight line on a log view can capture 93.1% of the variation in the data, not bad! These 520 months had an overall return of 3716% or 8.8% annualized. Finally, if we were to add together the absolute length of both negative and positive returns and compare it to what we got, then 25.7% of the total movement was realized into a positive return.
Essentially, long-term investment can be modeled more accurately using a straight line. There is more certainty of the outcome as growth is compounded and draw downs smoothed over.
How does this compare to a shorter-term view?
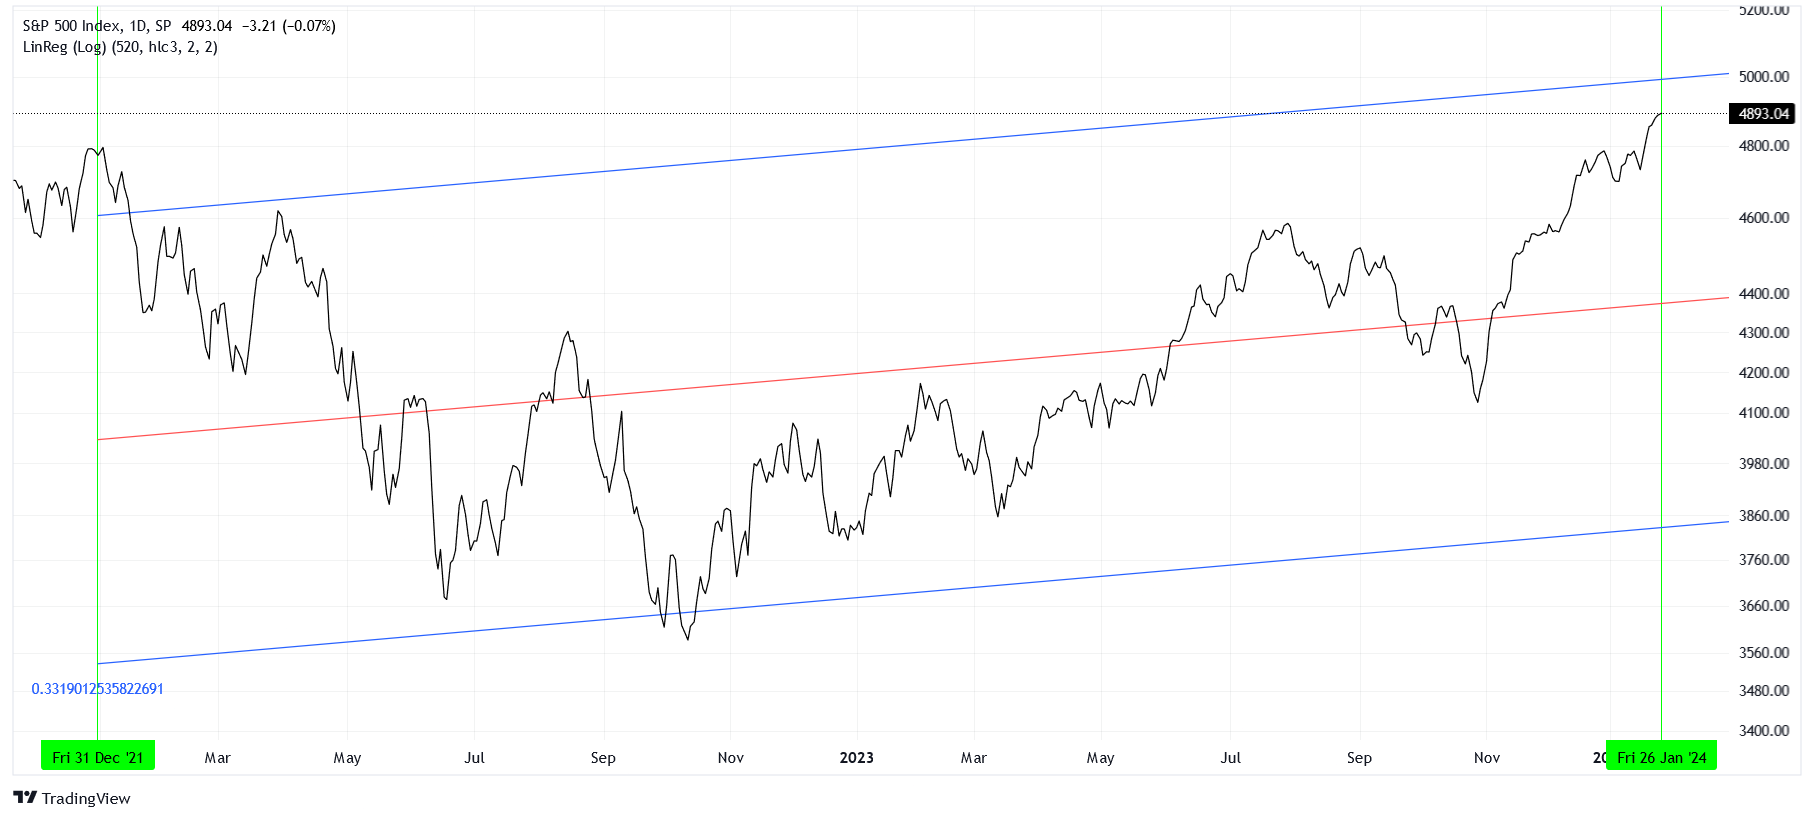
If we consider the last 520 days on the SPX, a log-linear regression model only captures 11% of the variation in the data, almost nothing. These 520 days had an overall return of 2.2% or a measly 1.06% annualized. Adding up the absolute movement and comparing it to what we got, only 0.55% of the movement was realized into a positive return.
What does this mean for traders and investors?
In the short term, the return went nowhere, but the chart went everywhere! Traders seek to capture short-term volatility, both on the upside (long) and the downside (short). These short-term returns are compounded more often. This is wonderful if you are exceptional but terrible if you are mediocre. Additionally, the profits will be taxed each time, so there is another headwind.
In the long term, we do not have to worry about volatility as much because the returns are more predictable. This is respectable if you are mediocre but boring if you are exceptional. Taxation is lower on profits after a year, a decent tailwind.
Conclusion
You have to be honest with yourself. Are you a mediocre or exceptional market participant? If you answer incorrectly, you could miss out on a bunch of money! Now, be honest...
How did you answer?