

Totally
Market returns, good and bad.

In this week’s article, we examine the assumptions behind “typical” market returns.
Common “Wisdom”
To estimate how well our stock market investments perform, we often look to history as a guide. For most, simply knowing the historical average annual return is sufficient.
Using monthly close data from the S&P 500 Total Return index (SPXTR or SP500TR), we can calculate this mean return, but we must proceed carefully. A total return index is preferable to a simple price index because it includes dividends.
First, we’ll calculate the relative change between any given close value and the close 12 months prior. While many people are familiar with percentage change, this measure of relative change can bias our mean toward positive returns, so we should use log change instead. After doing this, we find an average return close to 11%.
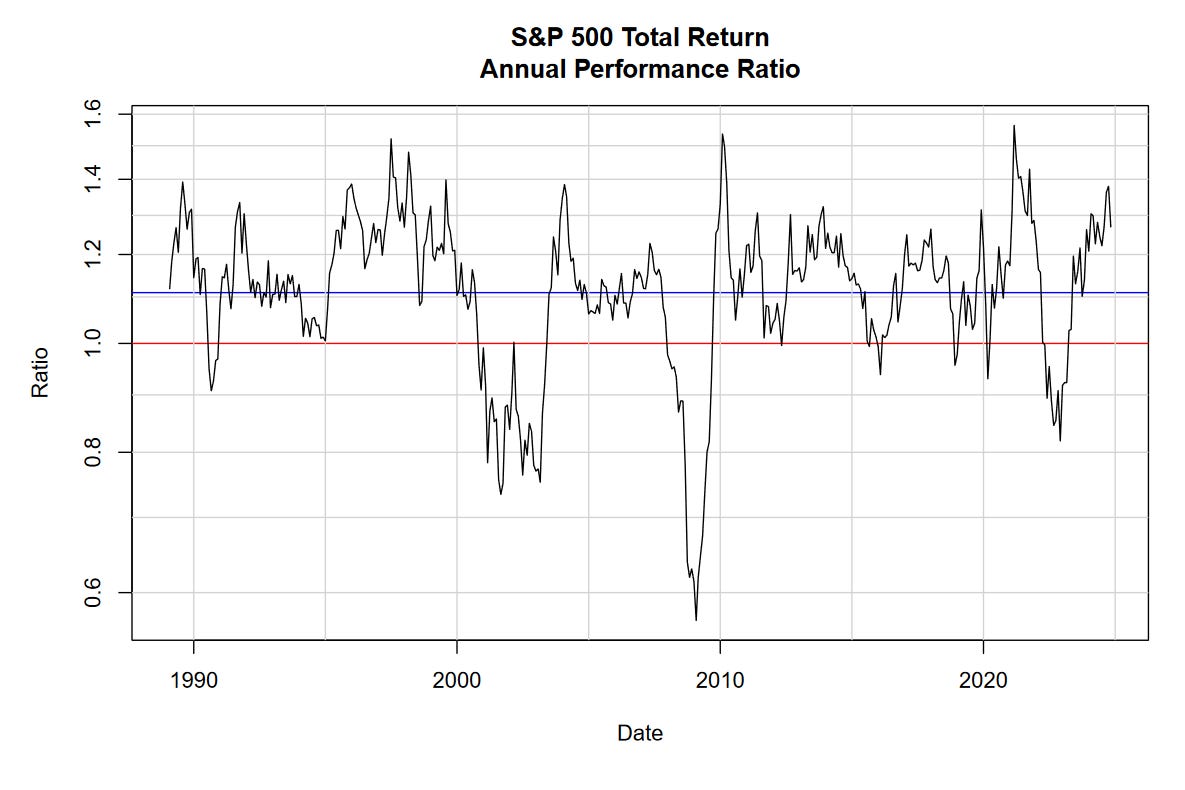
To visualize performance over time, let’s look at a chart of annual ratios between the current close and the lagged close 12 months prior.
Considerations
Ratios provide a useful between interpretability and accuracy. The chart above is scaled logarithmically, making positive and negative returns symmetrical and mathematically appropriate if we calculate a mean. It’s also easy to read. To convert a ratio to a percentage change, simply subtract one and multiply by one hundred. For example, 0.6 becomes -40%, and 1.5 becomes +50%.
Our annual mean return appears as a blue line in the chart above, at a ratio of 1.11. The red line at 1 represents no annual change; values below 1 indicate years of loss and values above 1 indicate years of gain.
Notice the wide range of possible returns. In a given year, we might have turned a dollar into a dollar fifty, or just as easily, into 60 cents! Expecting $1.11 every year would be foolish.
We should also consider the years included in our annual return data. The chart above shows data from February 1989 to November 2024. While this may seem adequate, it leaves out over 100 years of additional stock market activity (Charles Dow began recording his index in 1885).
Refresher
In future articles, we’ll revisit this topic in more detail, but for now, here’s a summary of what we’ve learned about calculating total return:
Use a total market index that includes dividends.
Avoid calculating averages with percentage change.
Instead, calculate averages with log change.
An average alone does not capture the complexity of a distribution.
Be cautious with data limited to a few market cycles.