

Twin Expectations
Two heads are better than one.

In this article, we consider two different perspectives regarding what should be a “normal” trend.
Old Normal
Being raised in the school of Graham and Dodd, we might expect that a company’s fundamentals “return to the mean,” or that the level of revenue, income, and cash flow seen in the past will return in the future. A good way to measure an expectation based on history could be a cumulative average.
Let’s calculate a cumulative average of Nike’s (NKE) price-to-sales ratio, find the spread between it and the actual ratio, and use that to generate a price expectation.
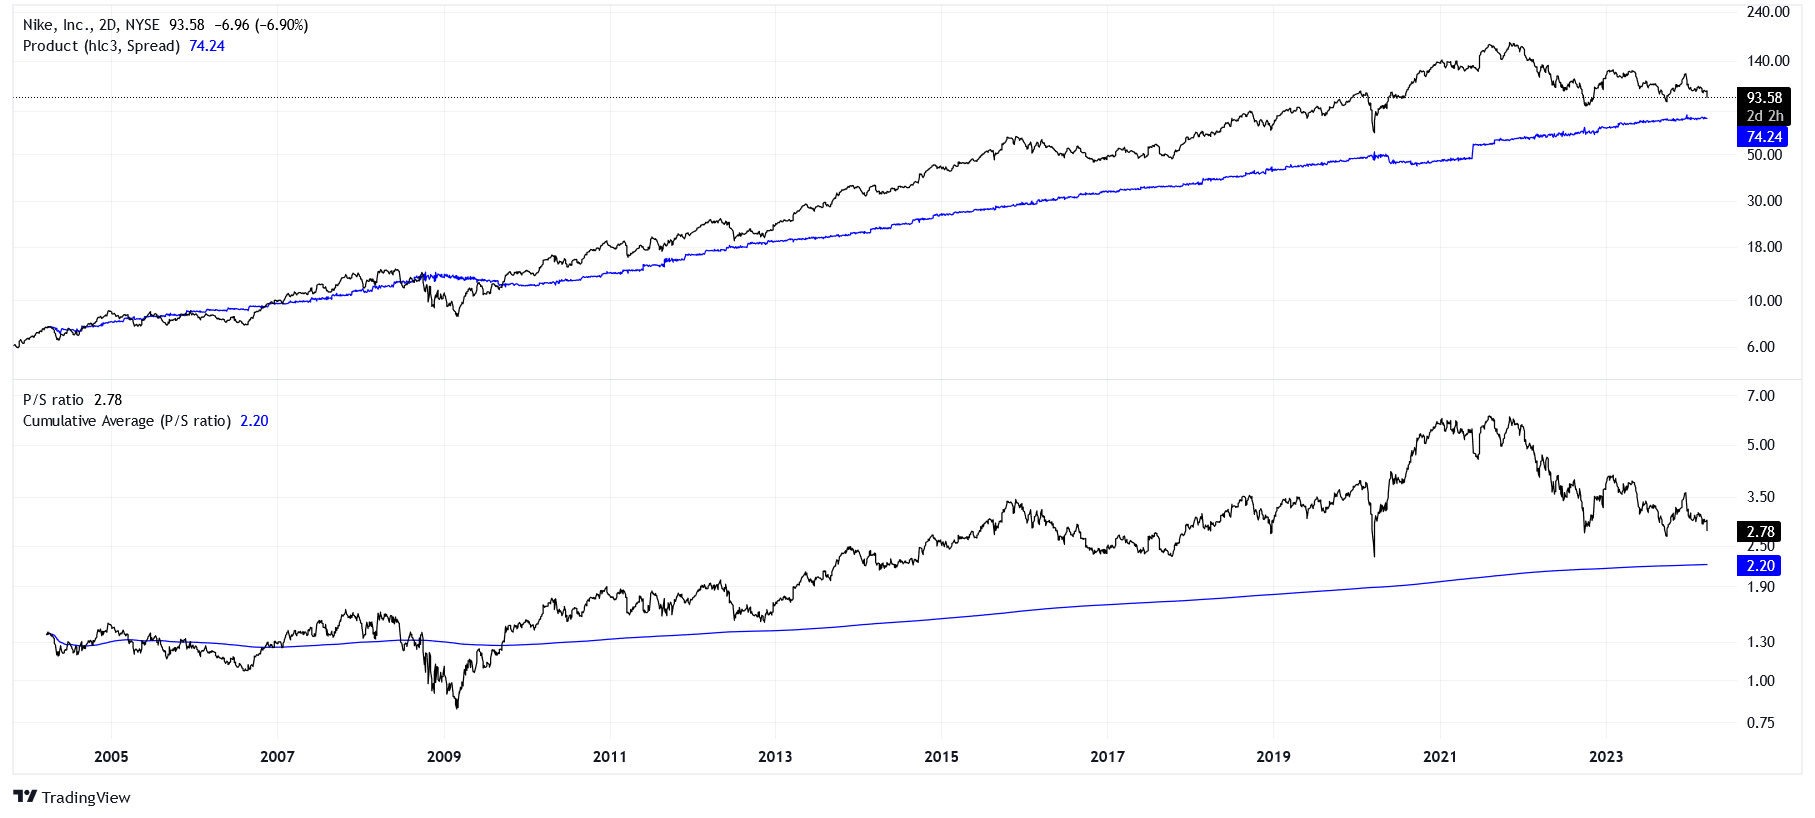
Remember, the spread between the actual P/S ratio and the cumulative average is what generates our price expectation seen in the top chart. This is also why the cumulative average is smoother than the expected price.
If we are accustomed to the historical revenue streams from NKE, then the current stock price of $94 looks expensive to us! We would consider paying $74 as a “fair-value” price. To make the point more nuanced, this expectation would be inaccurate if NKE has been able to sustainably grow its margins, reflecting a better ability to generate income from revenue than in the past.
Regardless, we have set up the first expectation of “normal,” or the more conservative of the two. How else can we look at a “normal” trend?
New Normal
Markets tend to build bubbles as participants are lured into a “new normal.” This will always seem foolish after the bubble has burst, but there is a strange logic to a bubble as it is being built.
We could have a more liberal sense of valuation if we are able to constantly adjust our expectations to what we could expect of the future, not the past. A good way to measure an expectation into the future could be a regression model. Specifically, a log-linear regression model on the P/S ratio is used below.
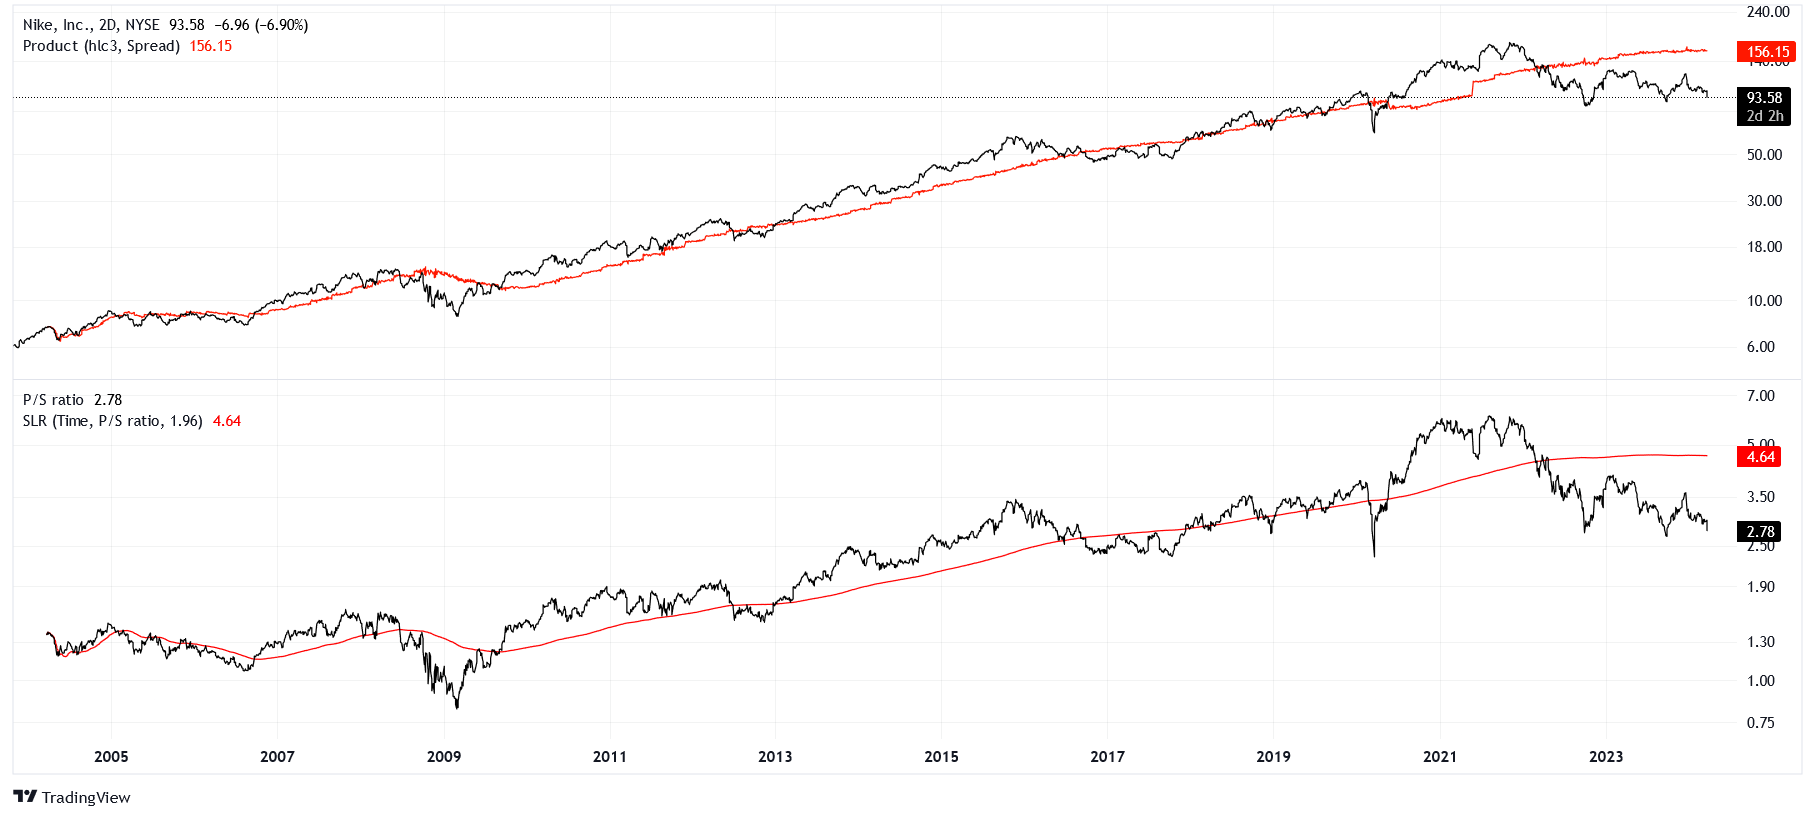
Trying to front-run emerging trends in a market where participants are willing to pay more and more for less and less revenue per share, we would be ecstatic at the current price of NKE! We would be willing to pay up to $156, which is considered “fair value” using a regression model.
As you can see, our price expectations between the past and future valuations disagree substantially with one another. There are moments when either of these models shines. We want to be conservative in bear markets and liberal in bull markets. But what if we wanted to be a good old-fashioned fence-sitter, just in case?
The Twins Cast a Vote
Simply put, we can take the average between the two techniques to arrive at a more moderate expectation.
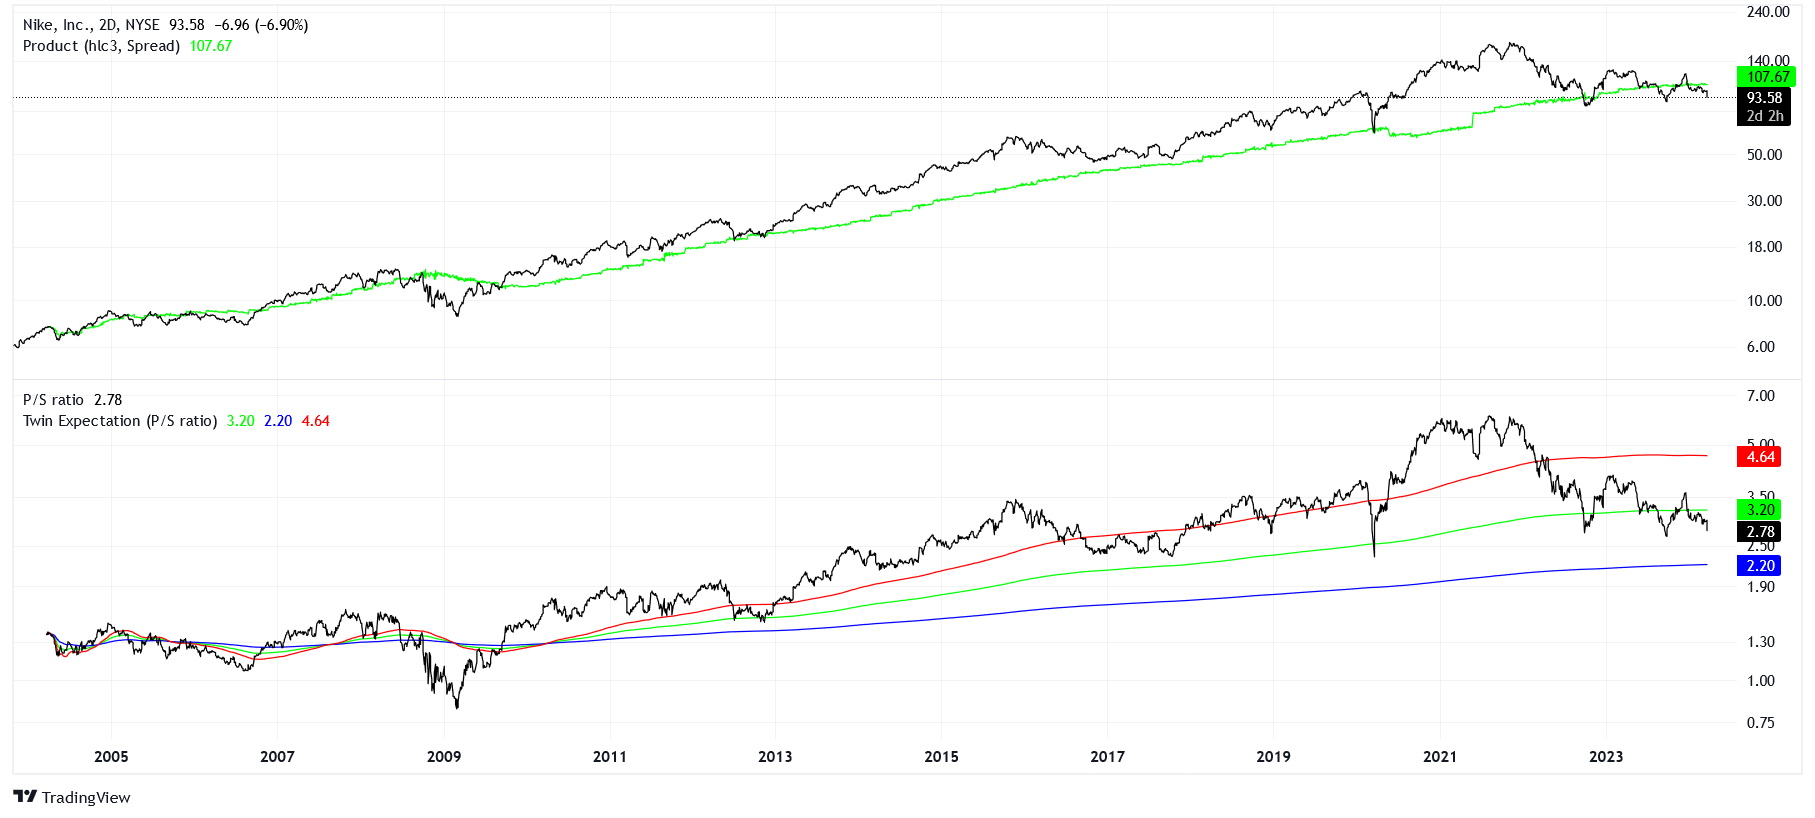
In the above chart, the green line is the mean between the cumulative average and the prediction from our regression model. The best part of this aggregate technique is that it captures the spirit of a conservative expectation and a more liberal one. This model is telling us that NKE is not too far off from its “fair value” price of $107.
Instead of looking at a single issue, which we only have 20 years of data for, we could look at the value of the entire stock market (sort of like a price) and compare it to the GDP of the country (the spread between the two forms something like a P/S ratio). Let’s check that out in the next section.
Buffett Indicator
Did I mention that it was actually Warren Buffett who came up with that idea? The Buffett Indicator takes the quotient between the value of the stock market over the GDP of the U.S.
Let’s see what the closest analog I could graph says for our current situation:
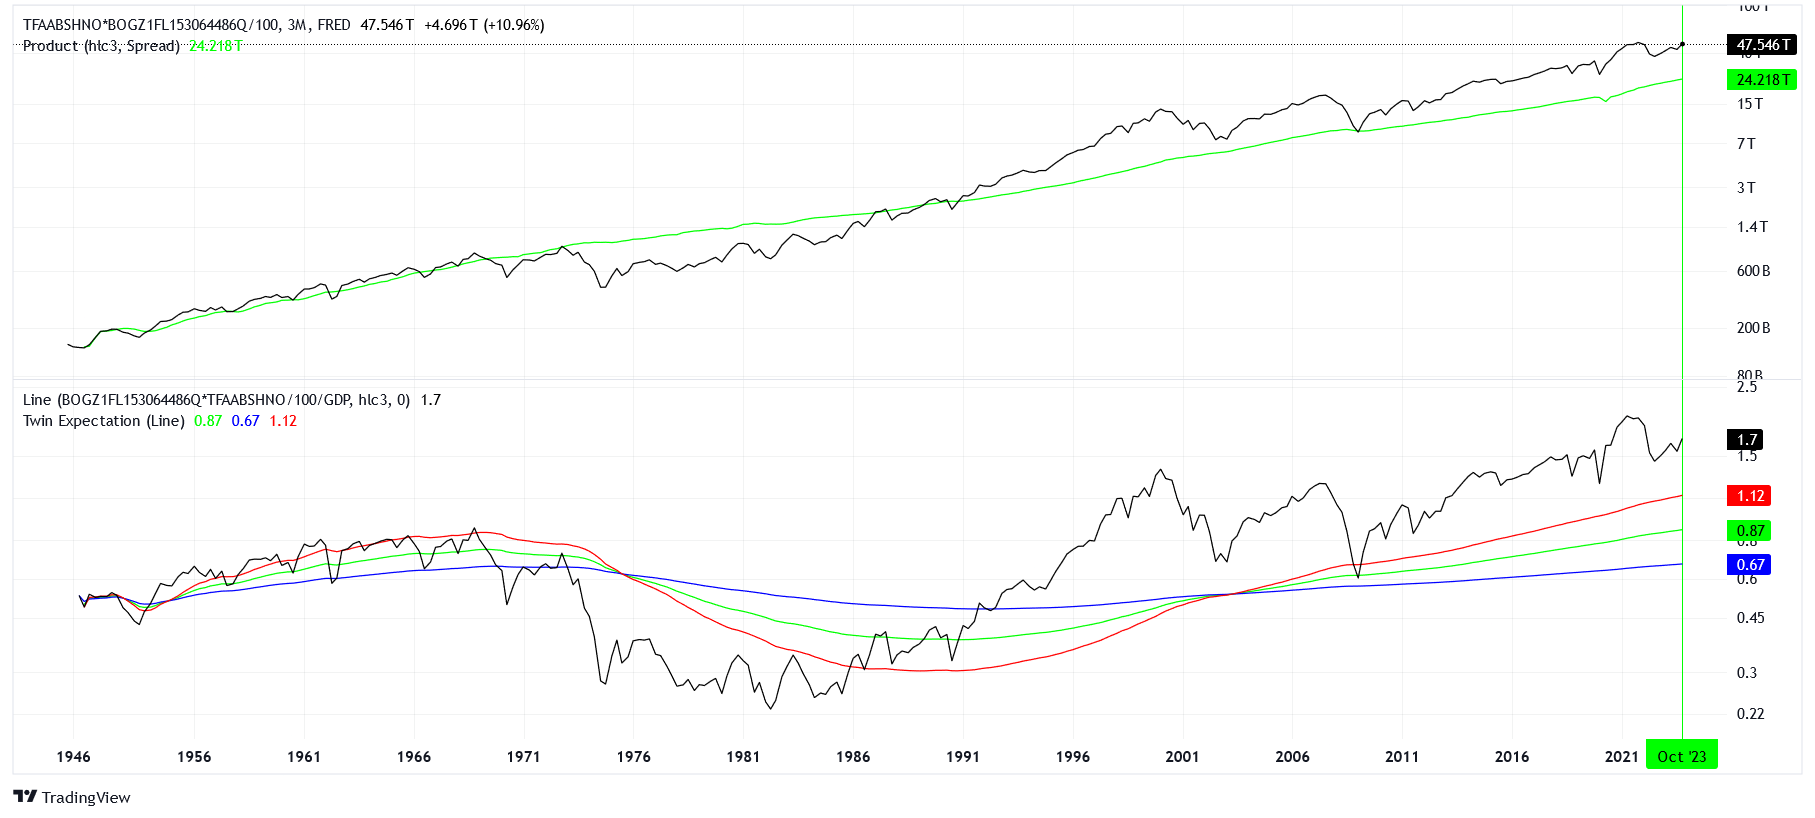
Given GDP, current equity values as of October 2023 were about +95% over what we would expect from a moderate “fair value” assessment. For reference, only Dotcom had a dearer assessment. There was a similar level before the GFC and we’ve been grinding along the current valuation since 2014.
This is shockingly similar to the period between 1954 and 1968 where a “ceiling” on the equity value expectation was stable before eventually unwinding. Recall the textbook example of a narrow, concentrated market dominated by the “Nifty Fifty.”
Sound familiar?