

Vexation
Solving the VIX puzzle.

The VIX moved up sharply last week but price remained muted. What gives?
A Shock to the System
The Chicago Board Options Exchange (CBOE) Volatility Index (VIX) attempts to predict future volatility based on the price of options with an expiry that is 30 days out. While this is only a basic definition, and there are many issues we could raise with how the VIX is constructed, we will use it as it is often used, as the “fear index.”
On the 5th of August, 2024, the VIX spiked up to 65.73. This is the highest reading the VIX has produced since March of 2020. Specifically, the VIX had topped out at 85.47 on March 18, 2020. This means that what happened last week is a big deal!
Typically, the VIX moves up as price declines, because investors rush to buy options as insurance for their investments. This past week, however, did not see large moves in the S&P 500 cash index, relative to past corrections. How come?
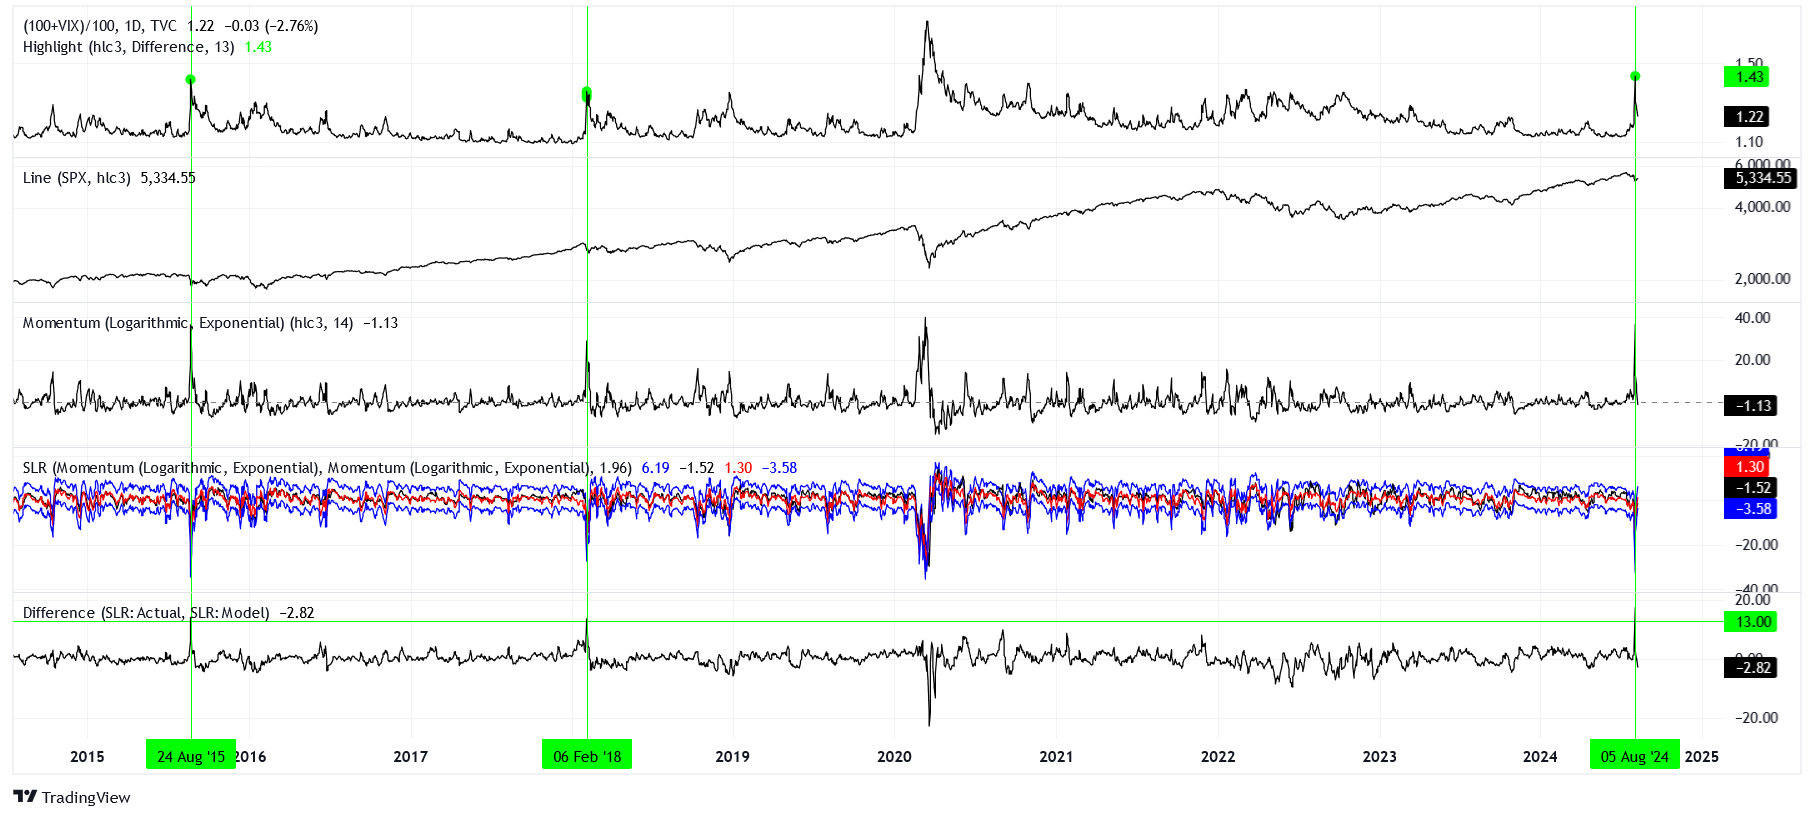
To investigate, we can refer to this huge mess of a chart:
This is what I deserve for mixing statistical modeling with charting, really ugly charts! In the next section, I will do my best to explain my chicken scratch.
Inspection of the Inflection
So, what’s going on in the chart above?
The first two charts show the underlying values of the relationship we want to investigate, that of the VIX and the SPX. To make sense of how the SPX typically moves in relation to the VIX, we can calculate the 14-day momentum of both. These momentum indicators can be seen in the next two plots. The fourth chart contains a model of the 14-day SPX momentum based off of the 14-day VIX momentum. Finally, the last chart shows the difference between the actual 14-day SPX momentum and the modeled momentum, otherwise known as the residuals of the model.
Working backwards, we can see that there was a large positive residual on August 5, 2024. This means that the actual 14-day momentum of the SPX fared much better that what we would have expected given the 14-day momentum of the VIX. There are a couple of other periods highlighted that had similar positive residuals.
February 6, 2018 might seem like an inconspicuous dip in retrospect, but in my opinion it set off a trend that wouldn’t be quashed for good until March 2020. August 24, 2015 was similar, although the trend it started would die out in early 2016. Put simply, while price was able to climb from these modest corrections, it would eventually correct back down to these pivot points.
Conclusions
What does this mean for the market in front of us?
There will be no gains without pain. Essentially, until bullish positioning unwinds and flips to become bearish once again, don’t expect rewards to come without later corrections. Another way of putting it is that the path ahead is more volatile than the path we have laid since October 2022.