

Zoom Out
Remember the big picture.

In this week’s article, we remind ourselves of critical macro cycles.
Macroeconomics
It’s true that the market is not the economy. Nevertheless, analysts love to look at the economy for predictions about the market. We’re no different here!
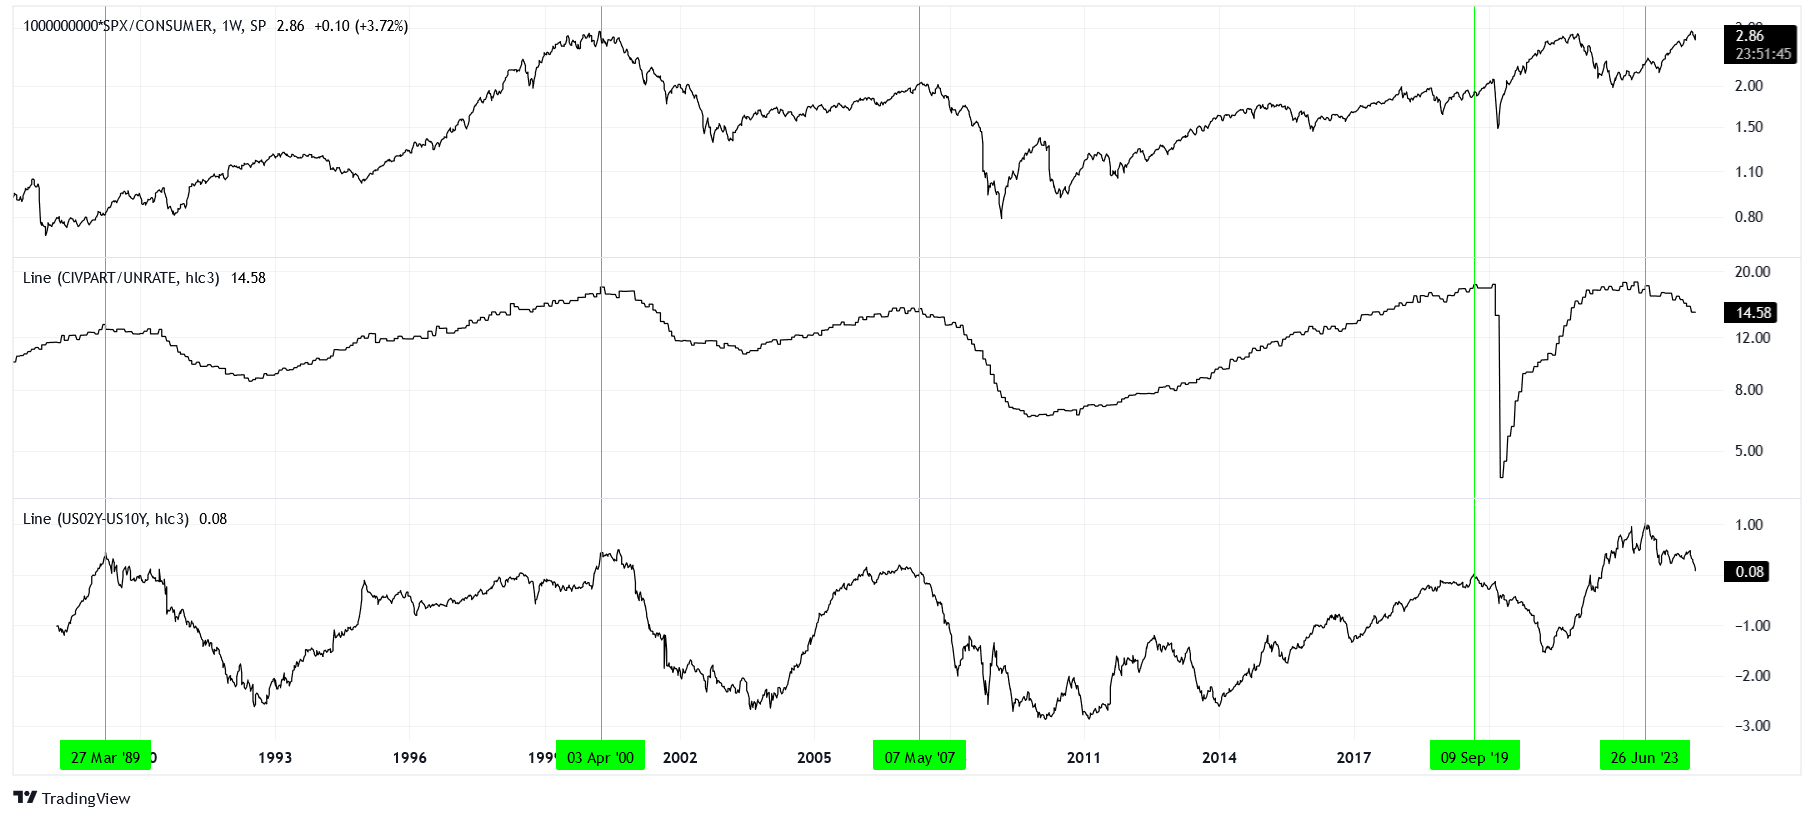
We can begin with a chart of the S&P 500 cash index (SPX) adjusted for total consumer loans (CONSUMER), the civilian participation rate (CIVPART) adjusted for the unemployment rate (UNRATE), and the 2-year Treasury note yield (US02Y) minus the 10-year Treasury note yield (US10Y).
What do each of these plots mean, really?
When we adjust the SPX for consumer loans, it’s akin to measuring how well credit in the economy supports the price of the stock market. Notice that 2000, 2021, and today see the market as not being well supported by credit. There’s not a lot of money to go around to fuel prices higher, which is the opposite case of 2009 for example.
In the second chart, we take the quotient between the participation rate and the unemployment rate to look at the strength of the labor market more generally. Observe that 1989, 2000, 2007, 2019, and 2023 have extremely strong labor markets. Today, the labor market is noticeably weakening. How far labor softens is another question entirely. We could see a shallow drop like the one from 1989 to 1993, or we could see a very deep drop like 2007 to 2010.
Finally, the last chart is showing the current inversion of the yield curve. Typically, rates for longer term bonds are higher because you want to be paid more for the additional uncertainty of long time spans. This is not the case today. You’d be better off investing in short term bonds that pay you more than the long term bonds. This condition does not last forever. As the economy weakens, the Federal Reserve likes to cut interest rates in order to stimulate it. Short term yields fall quickly in anticipation and also in response to rate cuts. Long term yields follow suit, but at a slower rate. As yields fall, the bonds look less attractive to investors. So, investors like to move into these risk-free assets before that happens, which sets up a peculiar game theory problem that ends in a bunch of investors moving to safety in long term bonds all at once. This “flight to safety” usually pulls money from the equity market to the bond market, so it hurts stock prices.
The Whole Enchilada
If we put all these factors together, which I consider the simplest view of the most relevant macro indicators, then we are at a particularly troubling arc of the market cycle. The market is expensive, labor is softening, and the yield curve is flattening from its inversion.
I believe that we will continue to see disappointing job numbers as the rate of change for unemployment is entering into the “steep part” à la 2020, 2008, and 2001. Furthermore, the “flight to safety” will continue, with investors preferring to capture what remains of high yields on long term risk-free assets as opposed to the fading future earnings potential of equities.
In short, I would not at all be surprised to see the SPX eventually drop down to 4125 during the unwind of bullish positioning.