

Don't Panic... Yet
Corrections happen.

In this week’s article, we examine the past six negative trading days.
Going Down
Recently, the market has experienced a number of consecutive down days (measured between the open and close of that day). The unease is palpable, some people are freaking out. Is this a typical correction, or the start of something bigger?
First, let’s simply look at the S&P 500 cash index (SPX) and an indicator that tells us either the positive or negative streak of daily price changes. It’s currently reading six down days in a row.
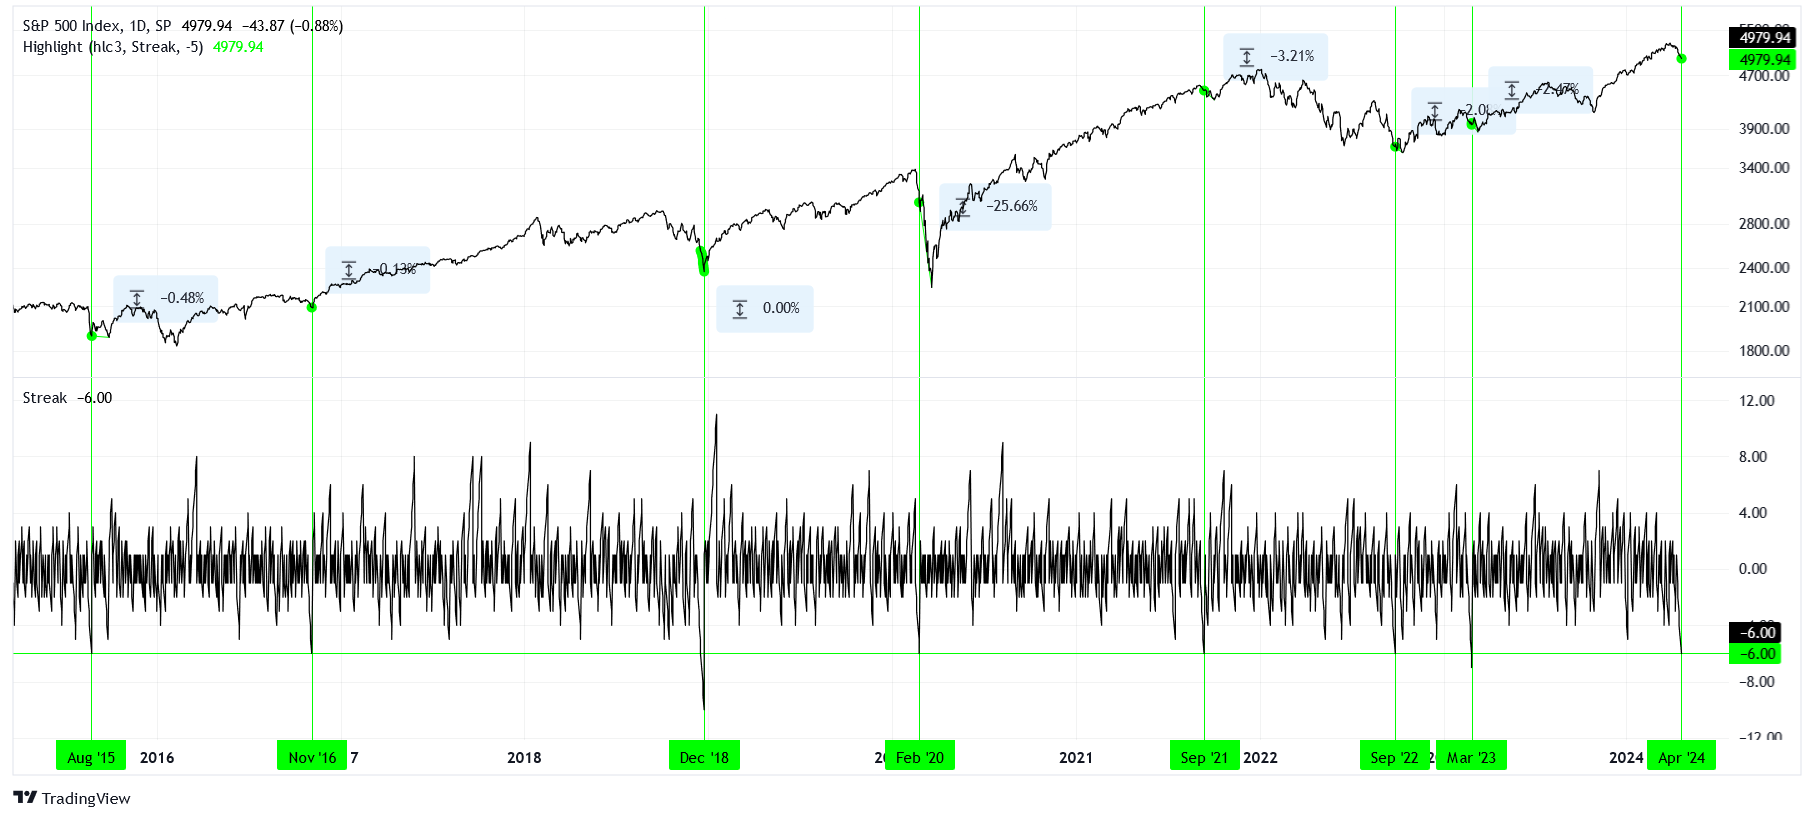
The above chart shows almost ten years of data. We see that there have been a handful of times when there were six or more consecutive negative trading days within this period. Eight, including right now, to be exact. Of these, only February 2020 saw a large extension beyond the end of the streak, a whopping -25.6% loss. The others saw more modest downside, contained to -3% from the end of the streak. For a handful of these moments, the end of the streak was the bottom of the trough! Six down days in a row are rare. The maximum on this chart is the ten down days seen in December 2018.
The million-dollar question becomes, “Is this a dip to buy, or the beginning of a crash?” History suggests that dips are far more common. We have to remember that February 2020 saw the world barraged with news of a novel virus that could be extremely deadly and would damage the entire economy. Today, we see news of escalating violence between Israel and Iran, and the vague threat of World War III looms over our heads. If a full-scale invasion were to be announced, that would be a potent geopolitical catalyst that could crash markets.
Until that comes, we have to keep our heads screwed on and see what the data tells us.
Mood Check
In a previous article of mine, “Long Until Wrong,” we learned about a complex sentiment indicator that incorporates options volatility indices, futures and options positioning data, and the spread between bullish and bearish assets under management (AUM) for a couple of popular leveraged ETFs. Let’s take a look at that indicator once more within the context of the current correction.
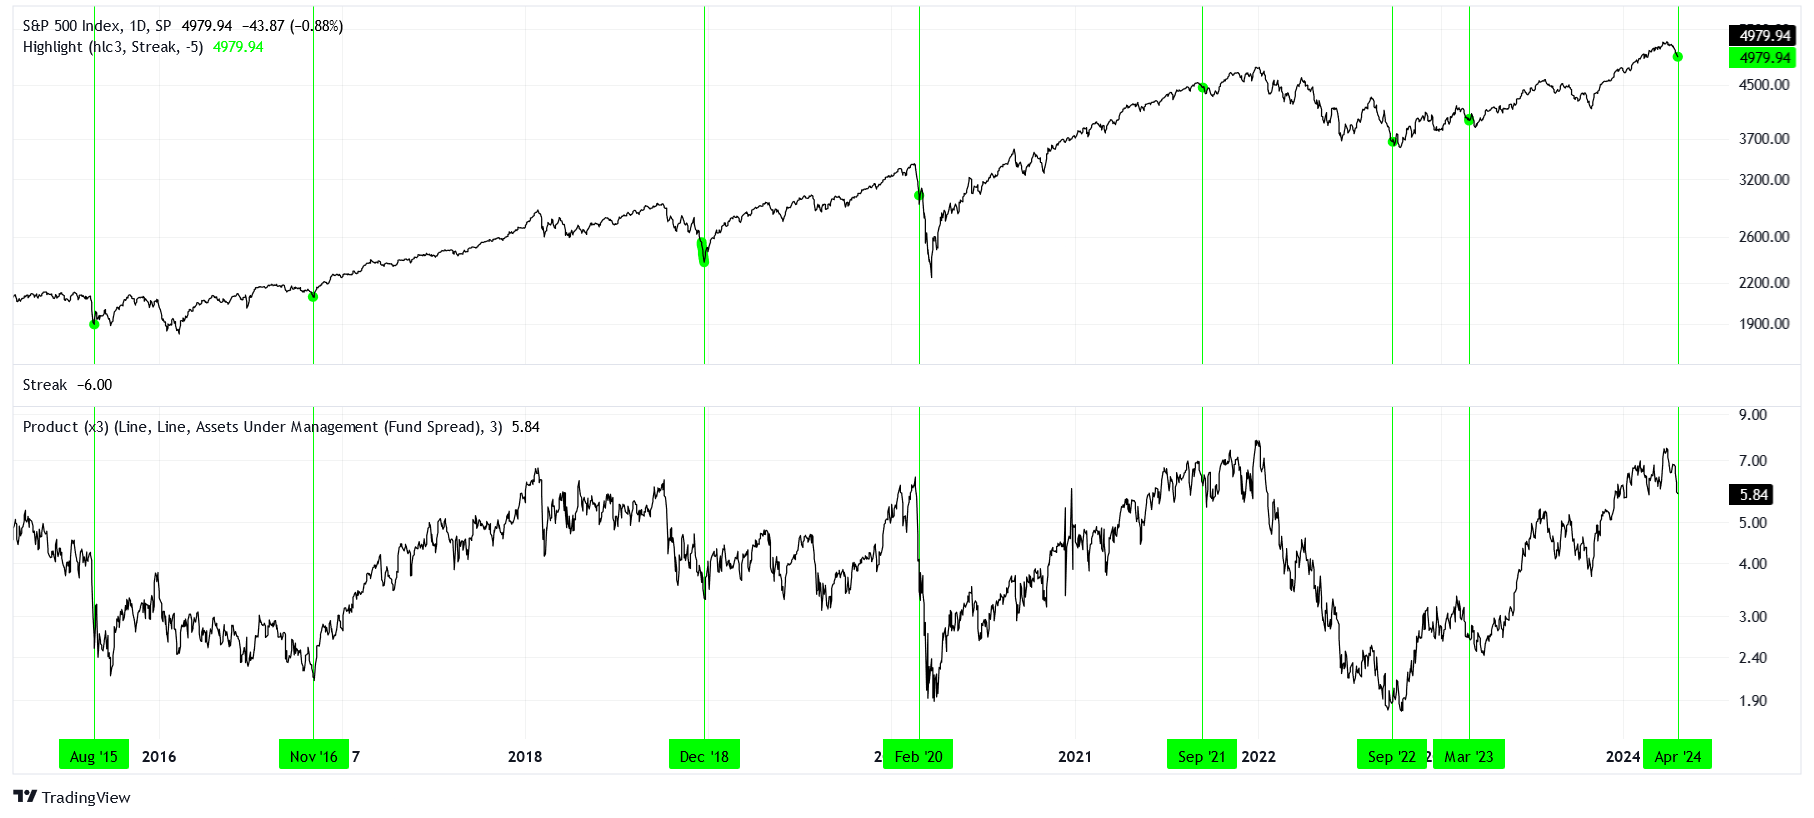
Since we last looked at this indicator, we’ve had a strong rally and are now as extended as we were back in November of 2021. The stage is set for the bulk of market participants to be offside for a downturn. Notably, this extension is characterized chiefly by extreme long positioning in futures and options. Options volatility has been muted, but it has been similar in the past. What is lacking is commitment to highly leveraged funds like the TQQQ.
The stage is set for the bulk of market participants to be offside for a downturn.
This doesn’t mean an extended bearish phase starting here is an impossibility. It simply means that instead of the bears attacking marginal exuberance (NFTs, the ARKK innovation fund, and zombie companies), the attack will be directed at the complacency in the structurally high valuation of the market itself (blue chips and the Magnificent Seven).
Closer
As mentioned in the article referenced above, the sentiment indicator works best when it violates a medium-term trendline. Thus far, the current trendline is still intact.
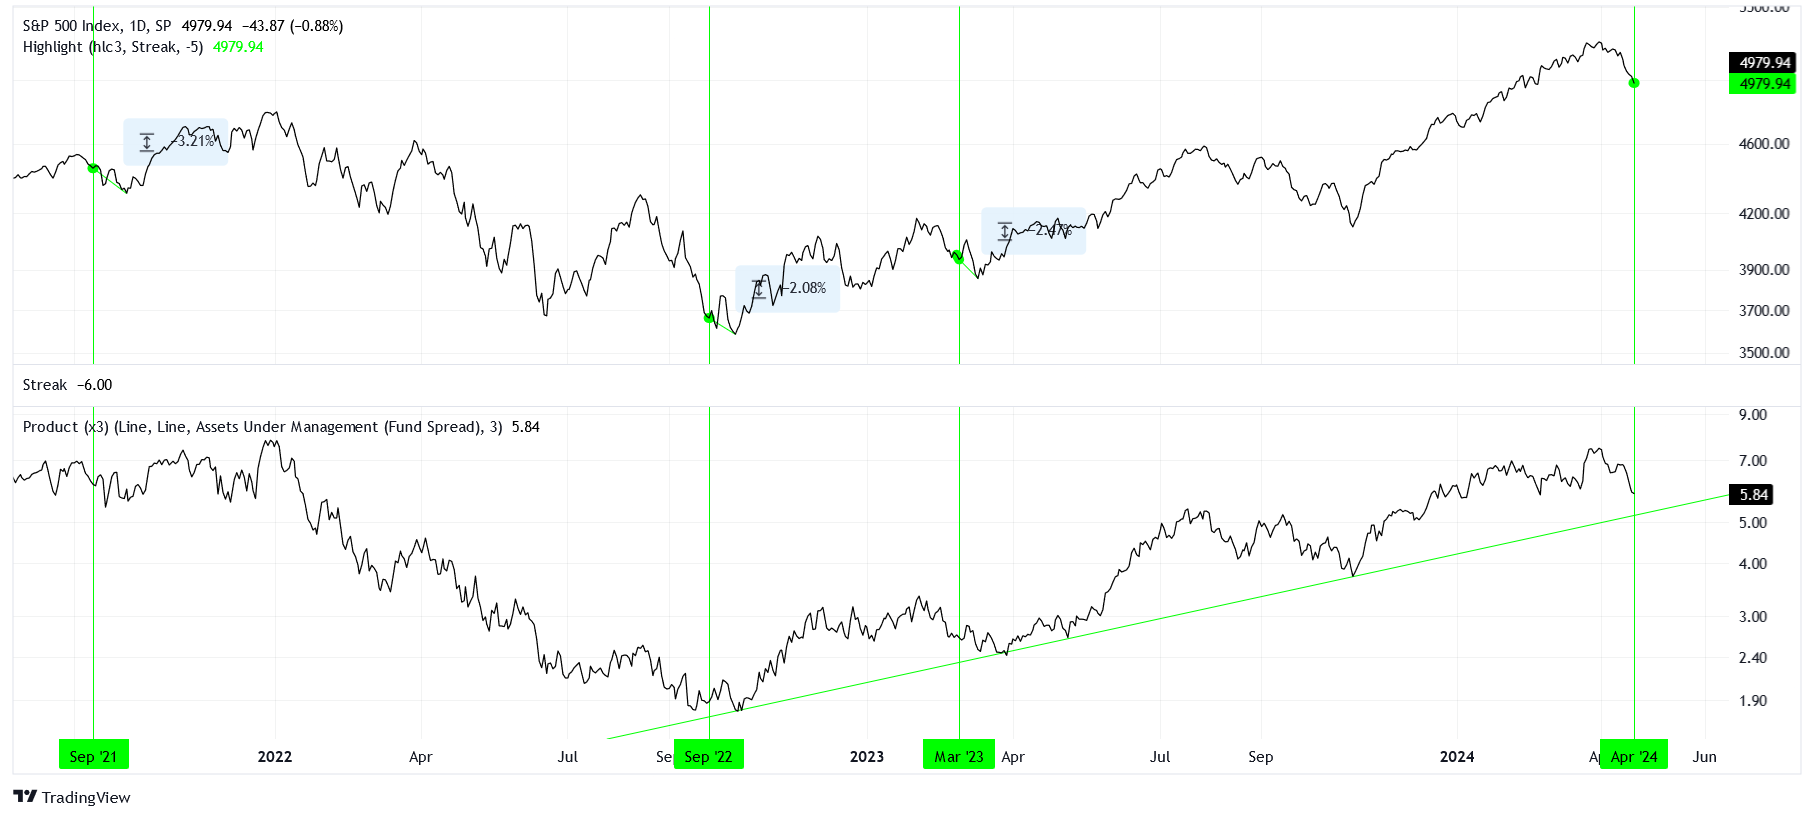
We’re getting closer to testing this line. I’ll keep you posted.