

Long Until Wrong
No one said riding a bull is easy.

In today’s article, we create a Frankenstein’s monster of a positioning indicator.
A Parade of Indicators
On this blog, we’ve discussed the indicators presented below, but we haven’t looked at their interactions before.
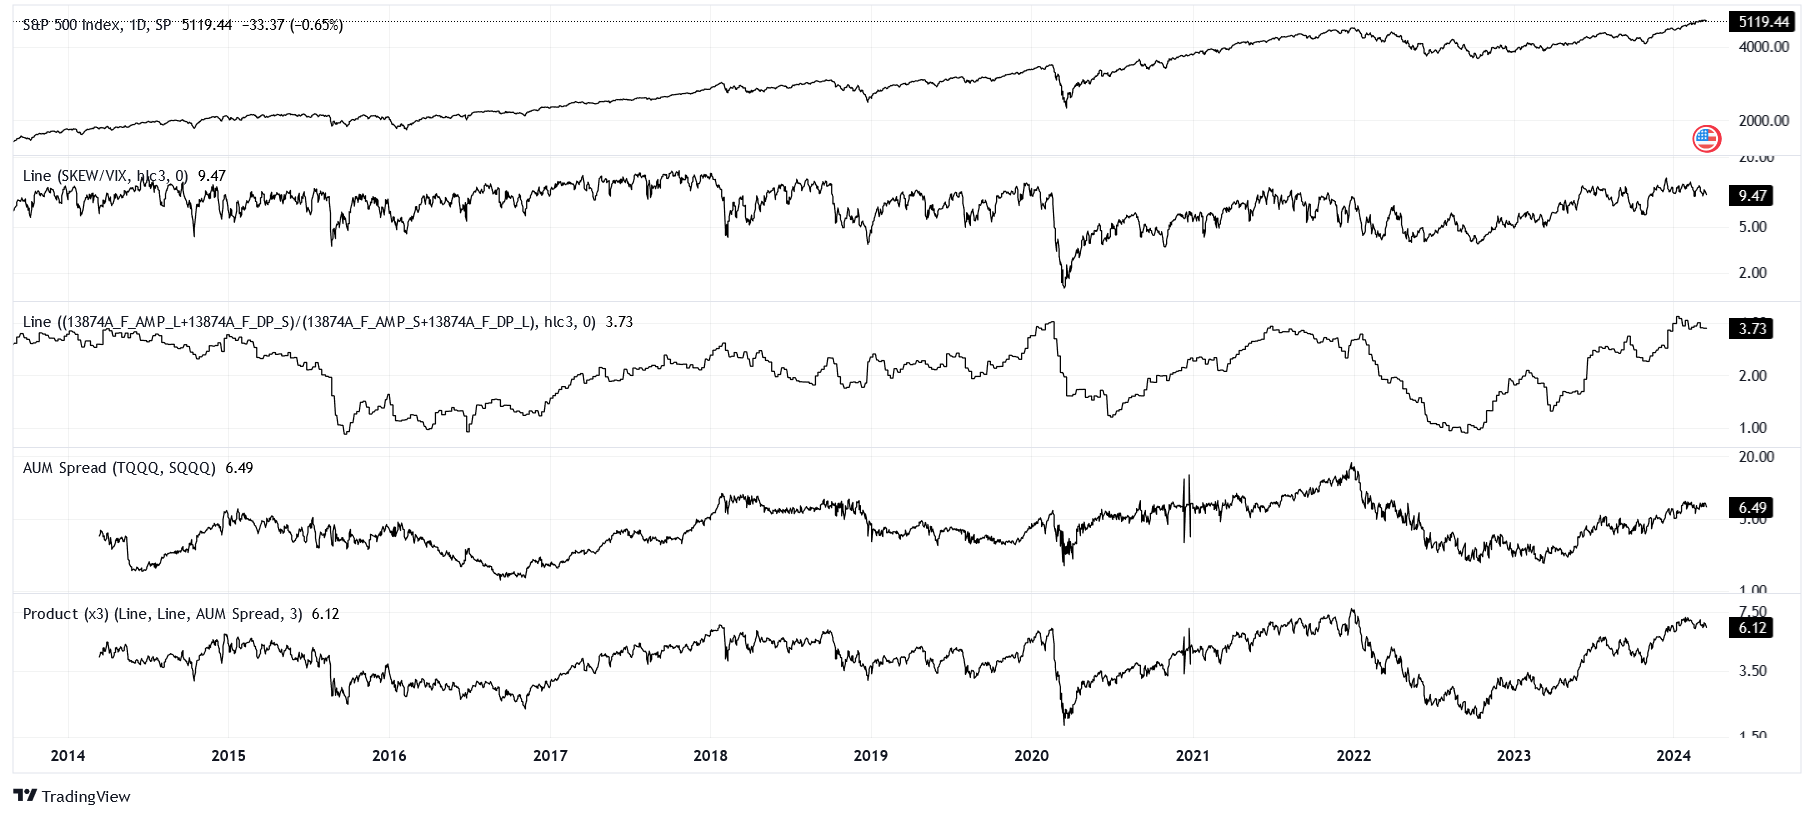
The options positioning indicator was mentioned in the “March 2024” article but was never properly explained.
While the VIX collates how the options market is priced for volatility for the next 30 days using a normal distribution, the SKEW allows for a skewed-tail distribution. Higher values on the SKEW mean people are bullish. Higher values on the VIX mean more volatility is priced in, which is typically during downside shocks.
If we take the spread of the SKEW over the VIX, we create a hybrid where lower values are more bearish. Take a look at the COVID drawdown as a good example.
The futures positioning indicator was described in the “Reality Check” article, and the AUM spread indicator was described in the aptly titled “AUM Spreads” article. I suggest you refer to those articles for a refresher.
Three heads are better than one, so we simply multiply the three positioning indicators together and take the cubed root to arrive at a single product. Since details are hard to see on this chart, we’ll zoom in for the next section.
It’s Getting Hot in Here
According to our positioning indicator, the equity market is as extended as it was in late 2021 and early 2018.
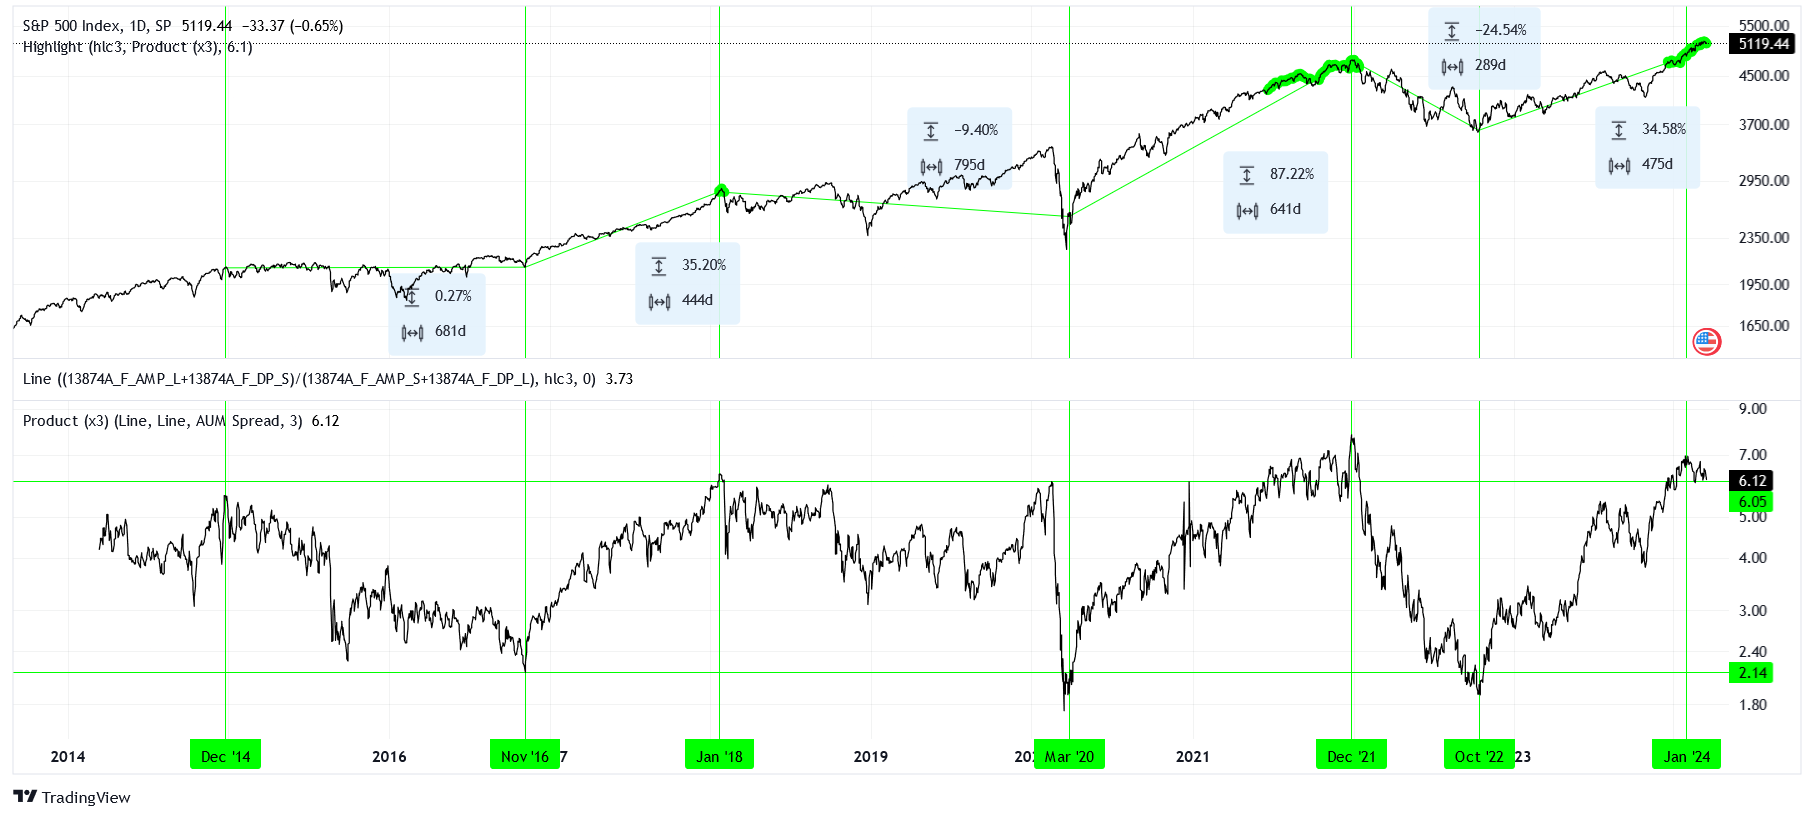
The path ahead is never certain. That being said, look at the path between early 2018 and early 2020 as positioning is resetting to bearish. In the same vein, look at late 2021 to late 2022 as another potential path while positioning is resetting. Before that, and although the peak wasn’t as extended, the path between late 2014 and late 2016 serves as another great example.
What do you see in these paths? I see volatility, flat to negative returns, and a whole bunch of worrying about one’s equity portfolio.
Now consider the inverse, where positioning builds up from bearish to bullish: late 2016 to early 2018, early 2020 to late 2021, and late 2022 to today. Price moves up relatively smoothly, barring a few shakeouts, and all the returns are highly positive. Life is good when you take the right position.
But when should we really worry? After all, positioning remained extended throughout late 2021 while the price slowly crept up, returns we don’t want to miss out on!
Getting Tactical
Below is the same chart, just zoomed in even more.
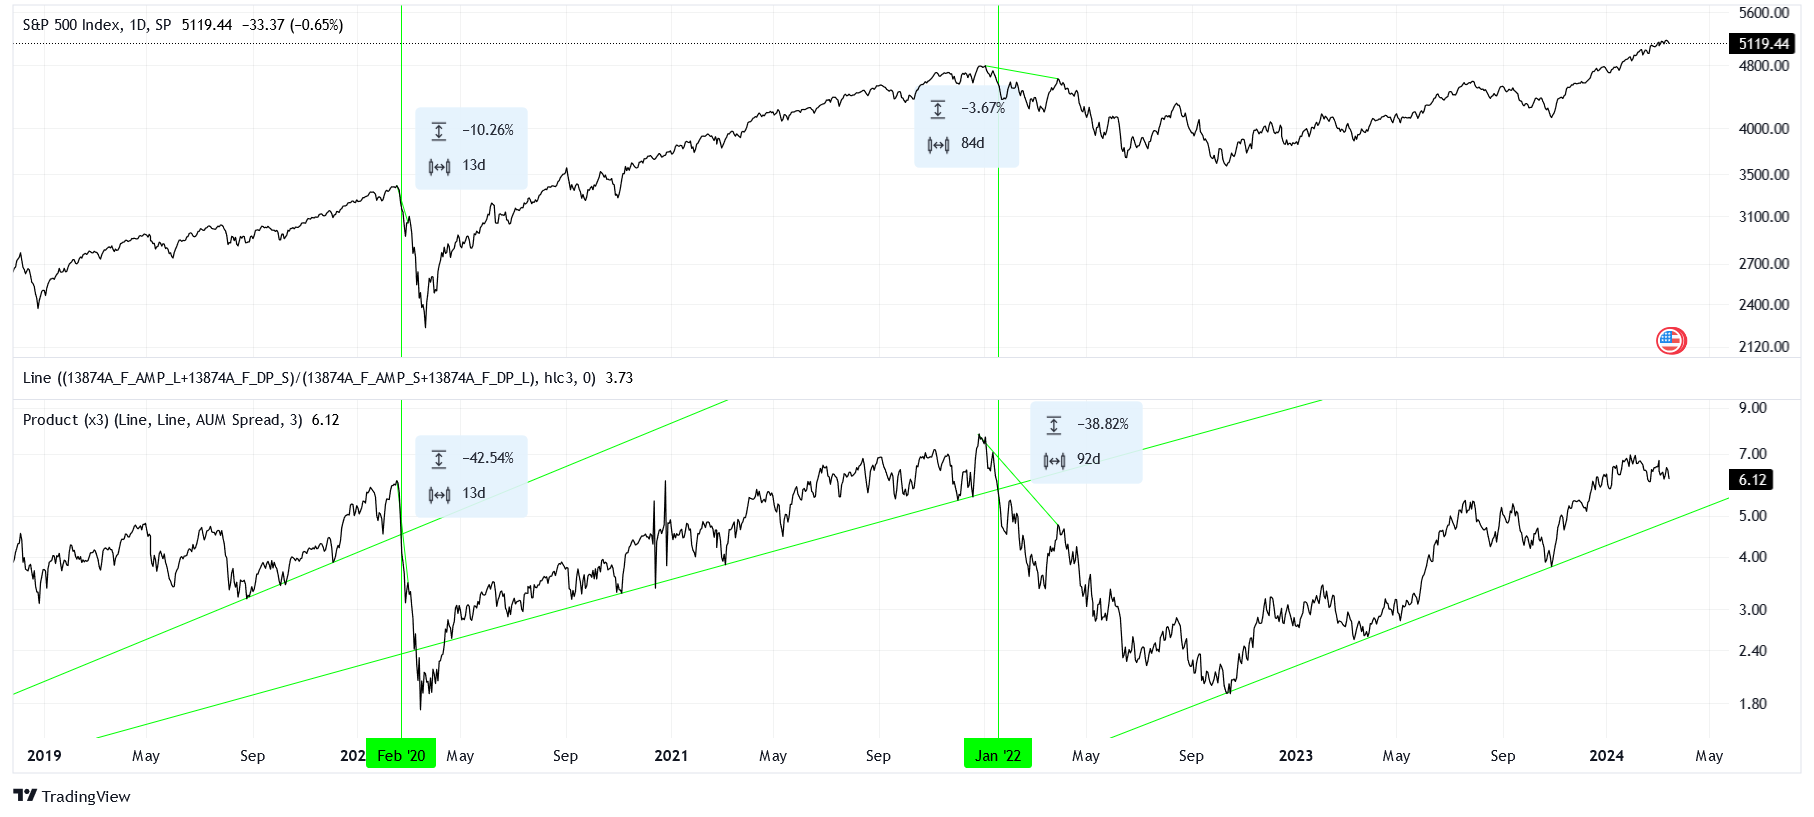
Notice now that our positioning indicator creates clean uptrends, not too dissimilar from the uptrends in price. These trends reflect the saying that markets take the stairs up and the elevator down. Bearish positioning sets in very quickly, and price moves to the downside rapidly.
We should worry when these uptrends are definitively broken, like in January 2022 and February 2020. Positioning is switching sides faster than the price is moving, and this is a big advantage for us.
Even if we are late to realize the change in character, the bulls usually make a final stand that gives us an opportunity to exit. A good example is March 2022, where the price is only down -3.7% since the peak made in December, but positioning is telling us that sentiment is bearish. If we had not already exited or hedged our positions, then that would have been a great time.
Conclusions
If our current uptrend is violated, I will let you know!
Until then, we’ll be long until we’re wrong.