

Panic
Stay frosty.

In this week’s article, we’re responsibly worried.
Remember When?
Back in April, the S&P 500 cash index (SPX) had a little dip down to $5000. Regardless of how small of a blip this correction ended up being, there was plenty of angst amidst the streak of six down days.
I wrote an article about the pullback here:

Between then and now, the SPX has push up as high as $5670, if we allow a little rounding. A 13% gain isn’t too shabby for a mere four months! Since July 16th, we’ve only seen lower prices and increasingly bearish positioning.
Will this correction end up being another blip? Another nothing burger? Or could this pullback be marking an inflection in market performance for years to come?
Mood Shift
Let’s take a look at sentiment once more. Remember that this is a combination of futures positioning, options volatility, and leveraged ETF assets.
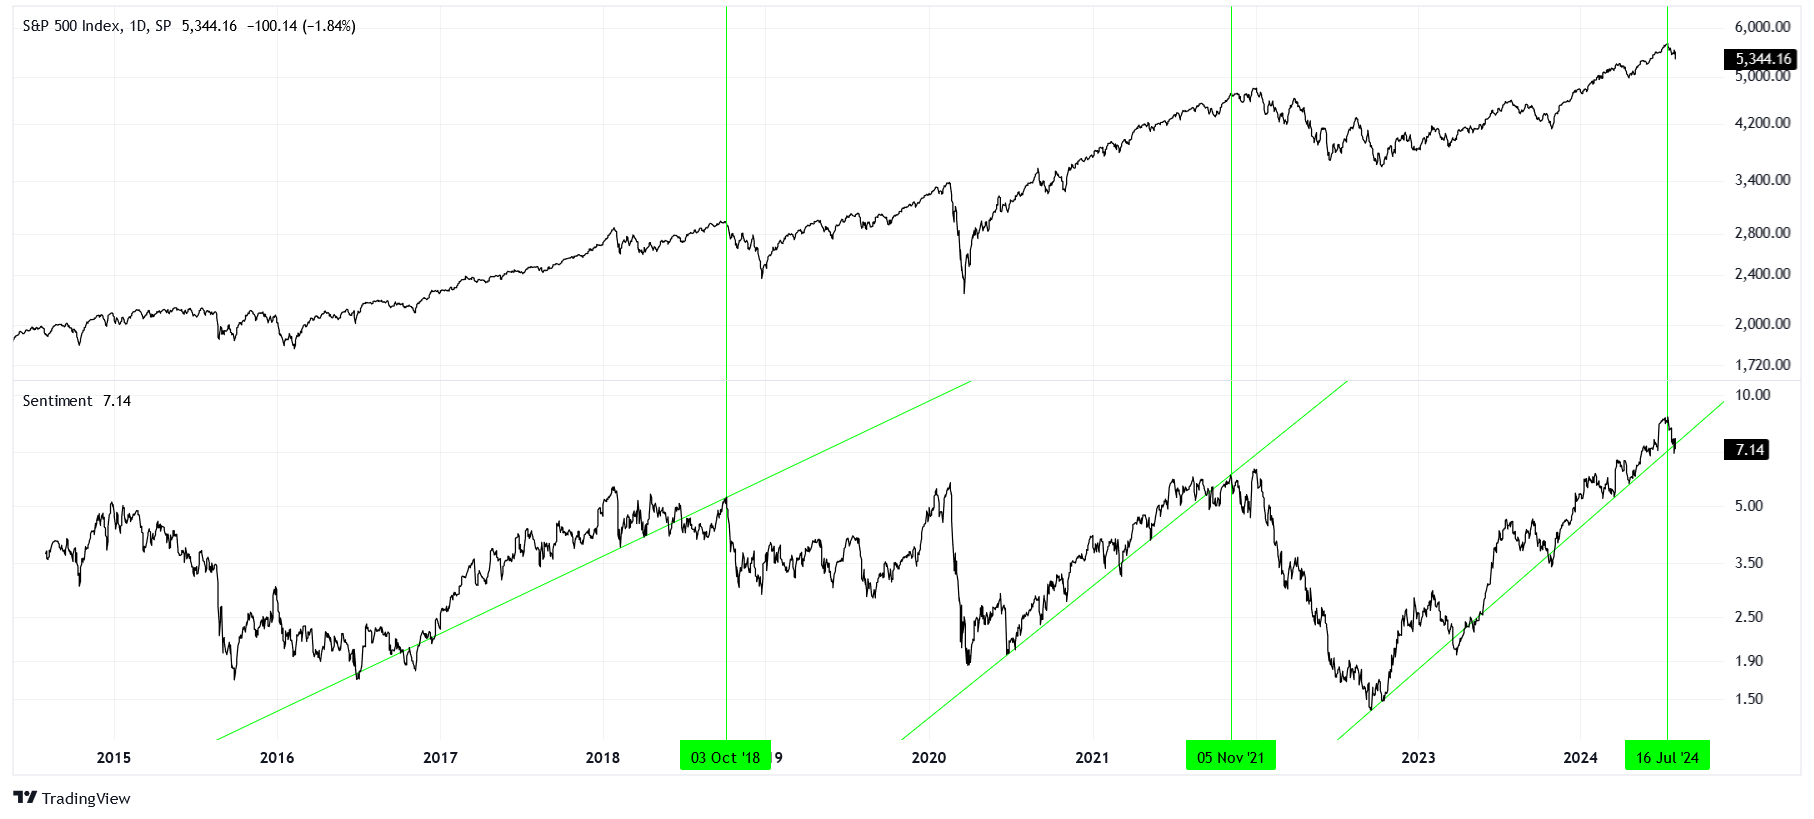
Not only did sentiment push to new highs not seen since at least 2014, but we’ve maintained a solid trendline going back to October 2022. We’re now flirting with breaking this trendline definitively. Once broken, it’s only a matter of time before we touch the trendline from below one last time.
It has been worrying to watch excessive bullishness build up. No fear, leveraged bets on future upside, and all while price pushes into new territory. Of course, this is exactly why price pushes to all-time highs, but I’m a bear and contrarian by nature.
That nature is telling me to be worried here.
Fear
We can look at a far more simple spread, the spread between the SPX and the CBOE volatility index (VIX).
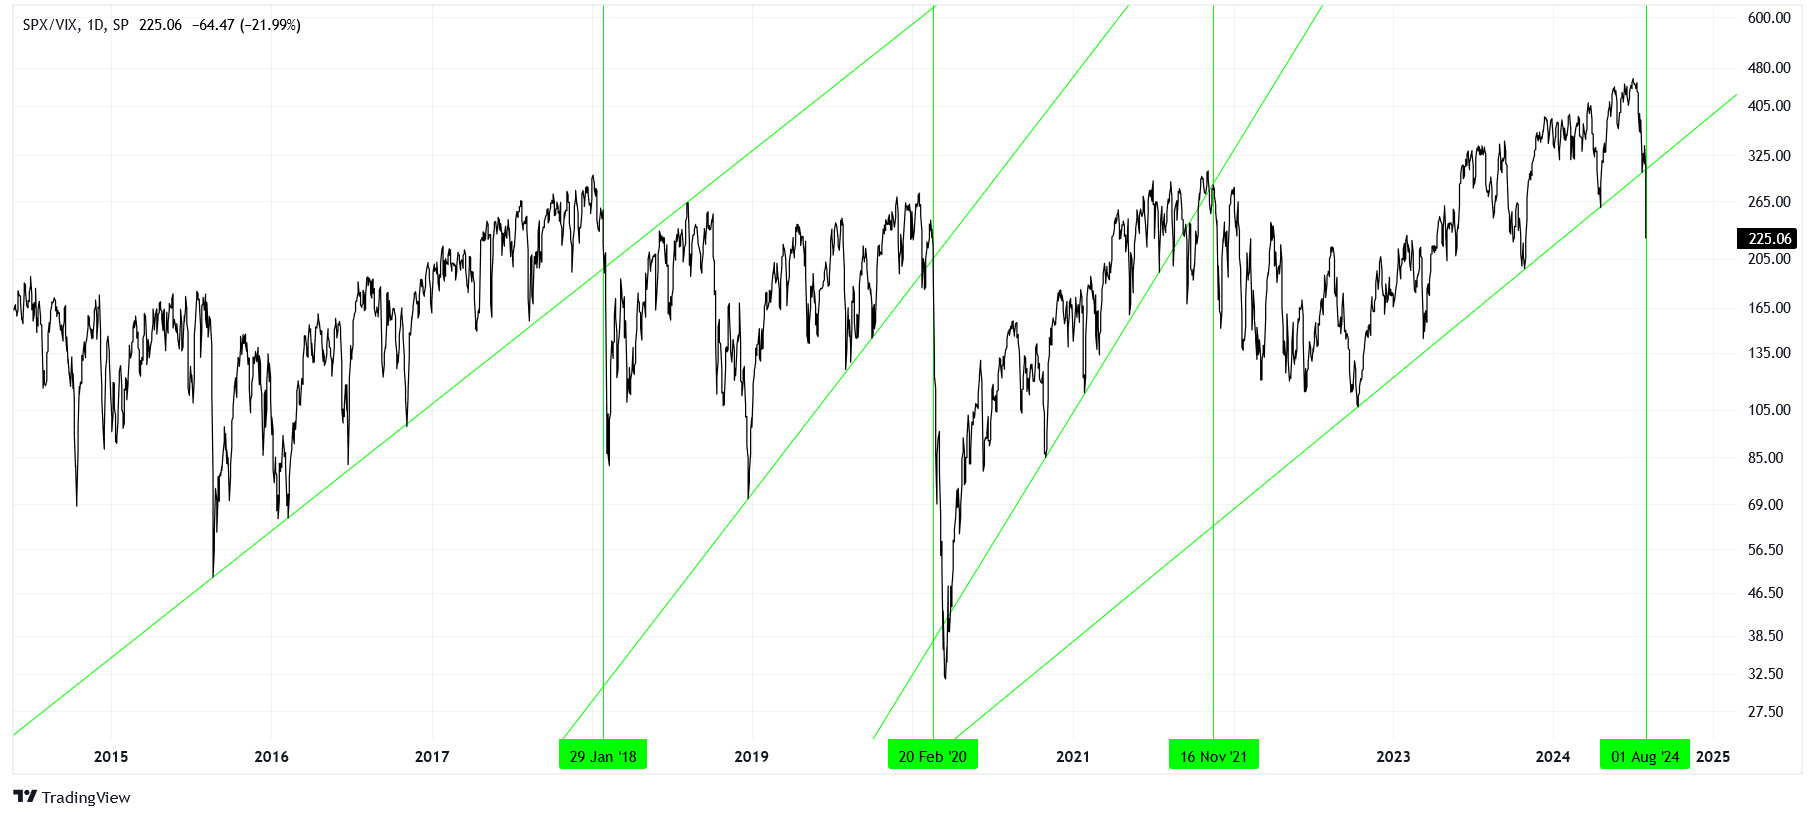
Essentially, this spread is telling us about how expensive the index can get without being afraid of pullbacks. Recently, fear has penetrated the ascending trendline that has held since October 2022, much like the sentiment indicator above.
Decisive breaks of rising trendlines in this spread include January 2018, February 2020, and November 2021 (I forgot to mark this one on the chart above). All of these periods were good times to start being tactically bearish.
Meanwhile, we’re flirting with a truly historic trendline.
Gigantic
Ever heard of the Great Depression? How about the popping of the Dotcom bubble?
Now, what if we were to connect the highs of 1929 to the highs of 2000 with a trendline on a log-scale? The chart below shows the result of that thinking.
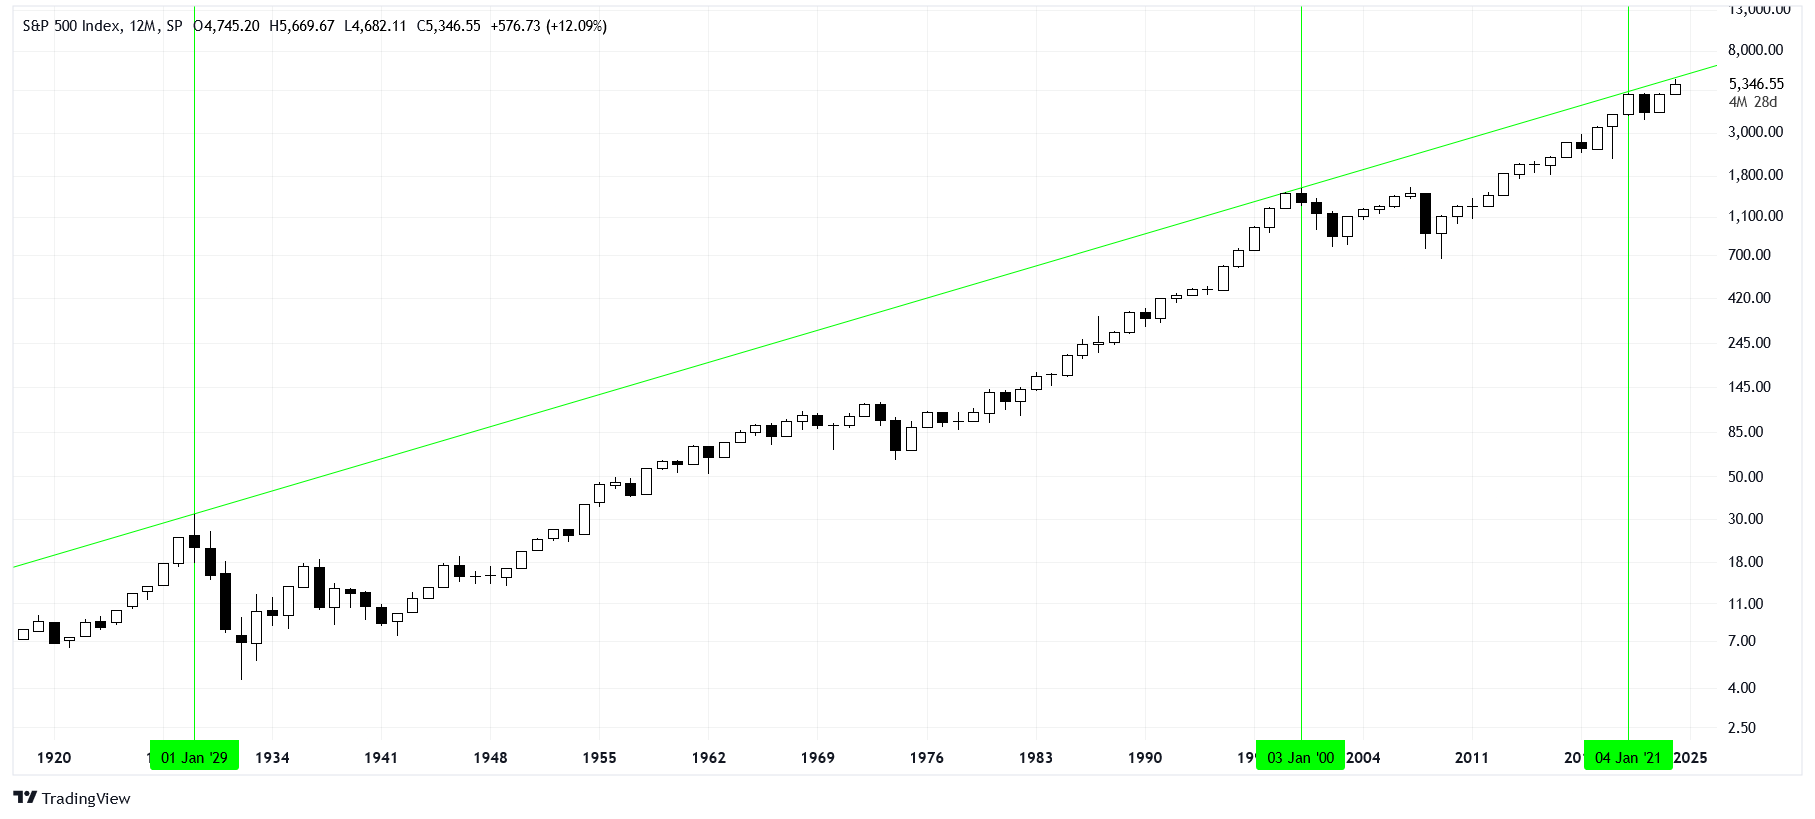
This trendline, defined by colossal market highs, served its purpose in 2021. By the end of the year, the SPX had pushed right up to this trendline, and then we had the bear market of 2022.
Recently, we’ve already pushed right back up to this trendline. We’re a little under the trendline as of today, but have tested it in 2024. Could it be broken to the upside? Of course. It’s just a line, not a magic formula. But it serves as a historically relevant psychological anchor.
1929 and 2000 would have been horrible times to get invested in the American equity market, on average (hence the index). This isn’t to say that some stocks within the market cannot perform well in the years to come, in fact that seems to be a certainty. But if you’re looking to invest in mega-cap American equities, maybe you should take your money elsewhere.
Now What?
I wouldn’t advise shorting the market, that seems to be a losing game in the long run. I also wouldn’t advise selling all of your shares, because we don’t have a crystal ball.
Get liquid. Take some profit off of the table.
Have enough cash or short-term investments that you feel like you have ammo for the dip to come. The dip could take a while (within a couple years). It could be lost time instead of lost performance, it’s important to know the difference.
The additional risk that you take on by investing in equities, in my view, will not be worth the returns to come in the medium-term view. Instead, cash, money market funds, and even some alternative asset classes look better here.
Don’t risk it.