

Plusquamperfekt
Perfect timing.

In this week’s article, we trade perfectly (with the benefit of hindsight).
Go Long
We’ve all heard this little number: “buy and hold.” Given the price history of the S&P 500 cash index (SPX), this isn’t such a bad idea.
What does this strategy look like if we plot our long position in black?
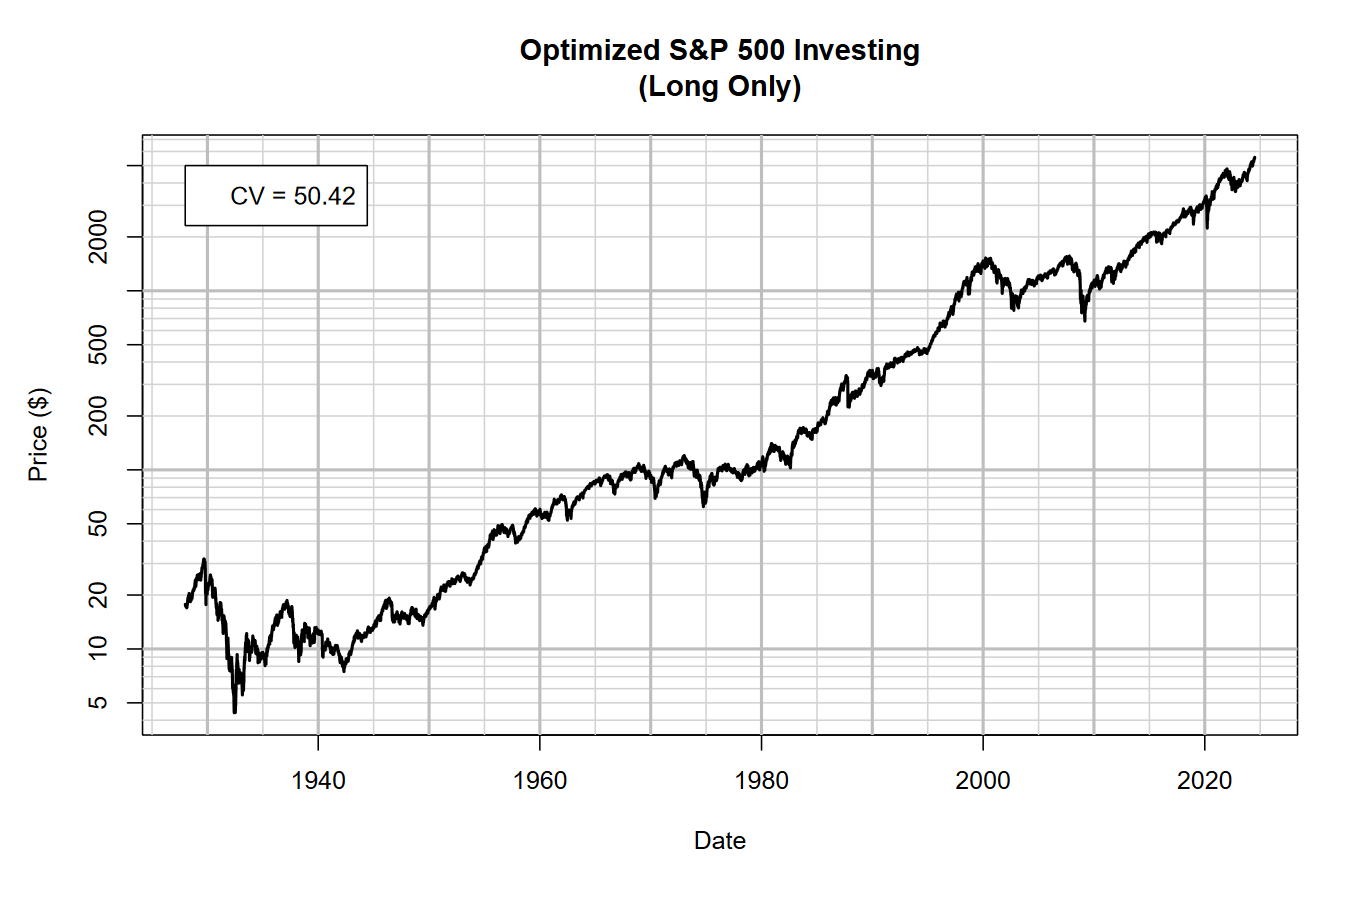
Oh, it’s… just a chart of the SPX, duh. In that case, we did pretty well just by going long and holding that position!
Perhaps you noticed the legend in the upper left corner, which assigns a number to something mysterious called the “CV.” This is the coefficient of variation (CV) of the daily log changes between close prices.
A coefficient of variation is simply the standard deviation of a dataset divided by its mean. Why use this measure? For a technical refresher, check out my previous article entitled “Signal to Noise.”

In short, the lower the coefficient of variation, the less noise we have compared to our signal. For us, the signal is performance, our return on investment. We want as much return and as little volatility as possible when investing.
Therefore, we could try to minimize the CV using strategies beyond “buy and hold.”
What was that really popular finance movie called? “The Big Short,” yeah. We should totally try shorting the market! What could possibly go wrong?
Cut Short
Full disclosure, I’m about to cherry-pick.
I’ve spent a lot of time looking at the SPX, maybe even a little too long. Regardless, it’s occurred to me that the best times to buy into the market would have been 1932/1942, 1974/1982, and 2009. Conversely, 1929, 1968/1973, and 2000/2007 would have been great times to get out. I’ve included some optionality because it’s not immediately obvious which years are better.
How will the computer optimize the timing of our shorts? We’ll allow it to wiggle around the dates for when we go short and again when we cover and resume our long.
Let’s try it out, plotting the periods of when we’re short in red.
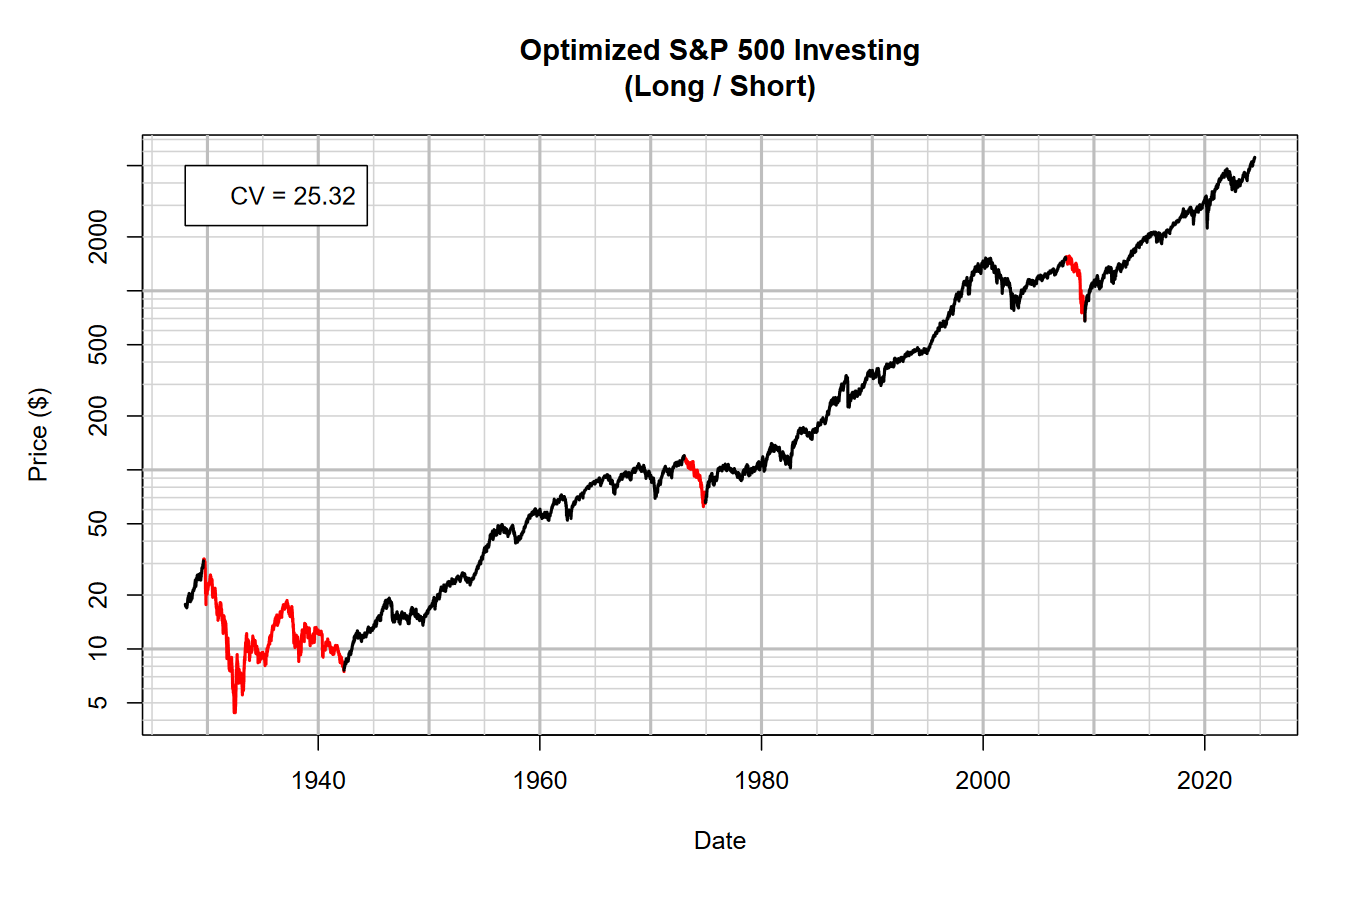
The computer decided to short in 1929, 1973, and 2007. Those shorts were covered and longs resumed in 1942, 1974, and 2009, respectively. Besides during the Great Depression, these shorts are extremely tactical, lasting only a couple years out of multi-decade cycles.
Notice the reduction in the CV. Its value was reduced from 50.42 to 25.32. Because shorting simply inverts daily performance, these reductions in the overall CV are due to increased performance. The simulation cheats, however, because fees are not paid on the short position.
Shorting can seriously improve the investment quality of a portfolio, but it requires perfect intuition for timing the market, which is exceedingly rare. Could there be another way to increase investment quality without having to be a superstar trader?
Cash Out
What if, instead of shorting, the computer can choose when to cash out? The gains or losses for that day will simply be nullified until the long is resumed.
Let’s check it out.
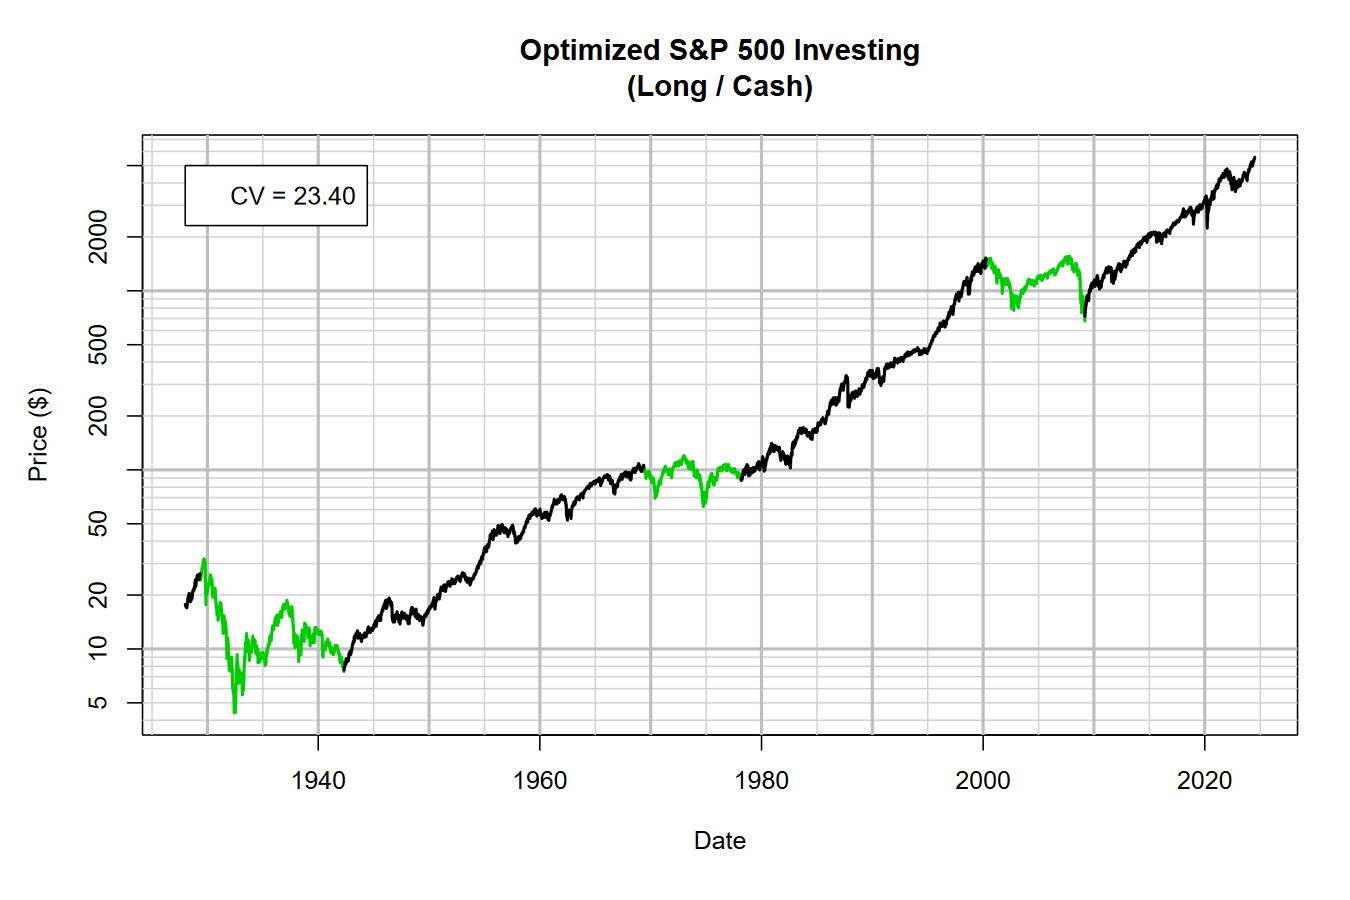
The computer decided to cash out in 1929, 1969, and 2000. It got back into the market in 1942, 1982, and 2009. Cashing out is far more forgiving than shorting, lasting about a decade for each period instead of a couple years.
The reduction in the CV was even more pronounced than with our shorting simulation, now down to 23.4, a marginal improvement. Most of these gains are due to decreased volatility or by avoiding losses, but not by adding performance like with a short position.
Conclusions
While “buy and hold” is a perfectly valid strategy, investment quality can be improved if we allow ourselves to tactically short the market or strategically cash out from it. I generally don’t recommend shorting; there are many disadvantages for the typical investor, and most of the time you will lose money doing so.
However, I do recommend cashing out or at least transitioning your portfolio into more liquidity if you believe the time is right. It’s a way of retaining the gains of your investment, avoiding periods of high volatility or losses, and can be psychologically comforting to know that at least a portion of your portfolio is not at risk.