

Calling the Top (pt. 2)
The dreaded macro hot take.

In this week’s article, we try to situate the market within a macroeconomic view.
Price Is What You Pay
I can’t time stocks. I don’t know anybody else who can either.
– Warren Buffett
Today, we will look at spreads that relate the price of the market to macroeconomic indicators. In general, we want to ask the question “is the market expensive?”
With a little diligence, we can arrive at an answer supported by the best evidence.
If you would like to learn about or refresh yourself on some of the details of the methods I use in this article, I recommend checking out the previous articles Twin Expectations and Five Reasons to Be Cautious.
The Buffett Indicator
The Buffett Indicator is simple. We take the current value of the stock market and place it over the current value of gross domestic product (GDP).
We use an analog of the current value of American equities: the product of the S&P 500 cash index (SPX) and its mean ratio to the value of total equity assets.
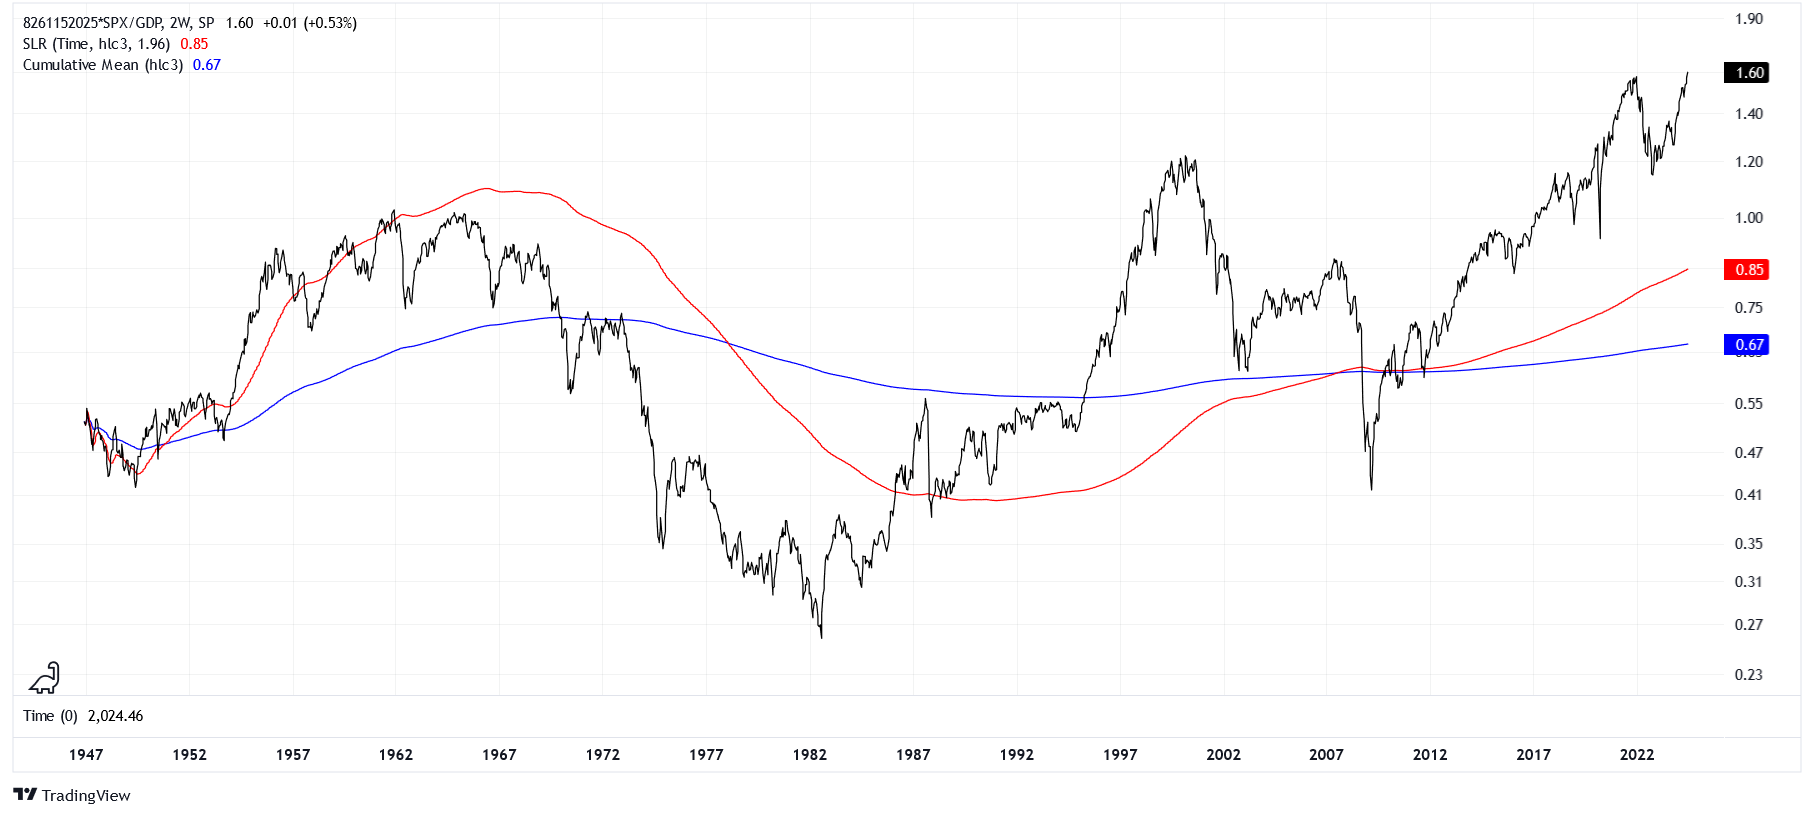
As we can see, the Buffett Indicator is as extended as it has ever been, nominally. While our analog claims that the value of the stock market is about 1.6 times that of GDP, the more accurate number is 1.8, not too far off.
Relative to our trendlines, the current level remains extended. Compared to the regression output, we are +88% over the predicted value. Compared to the cumulative mean, we are +139% over expectations. It appears that only 2021 and the Dotcom bubble saw dearer valuations within this context.
The Buffett Indicator is at the very least telling us to be cautious here, if not downright pessimistic about future returns. This is only one perspective, however. Fortunately, there are many ways to skin a cat.
Compensation of Employees
Bob Elliott once worked for Ray Dalio’s Bridgewater.
Now, he is a popular voice within “FinTwit.” Being a notorious holdout for not calling a recession in the macroeconomic space, his main argument is that our current cycle is primarily driven by income and not credit. Since income growth has been strong, he argues, then the contractions in credit and rising delinquencies on short-term loans are not much worry about.
Let us try addressing this argument from a different angle. How well does total employee compensation support the current price of the market?
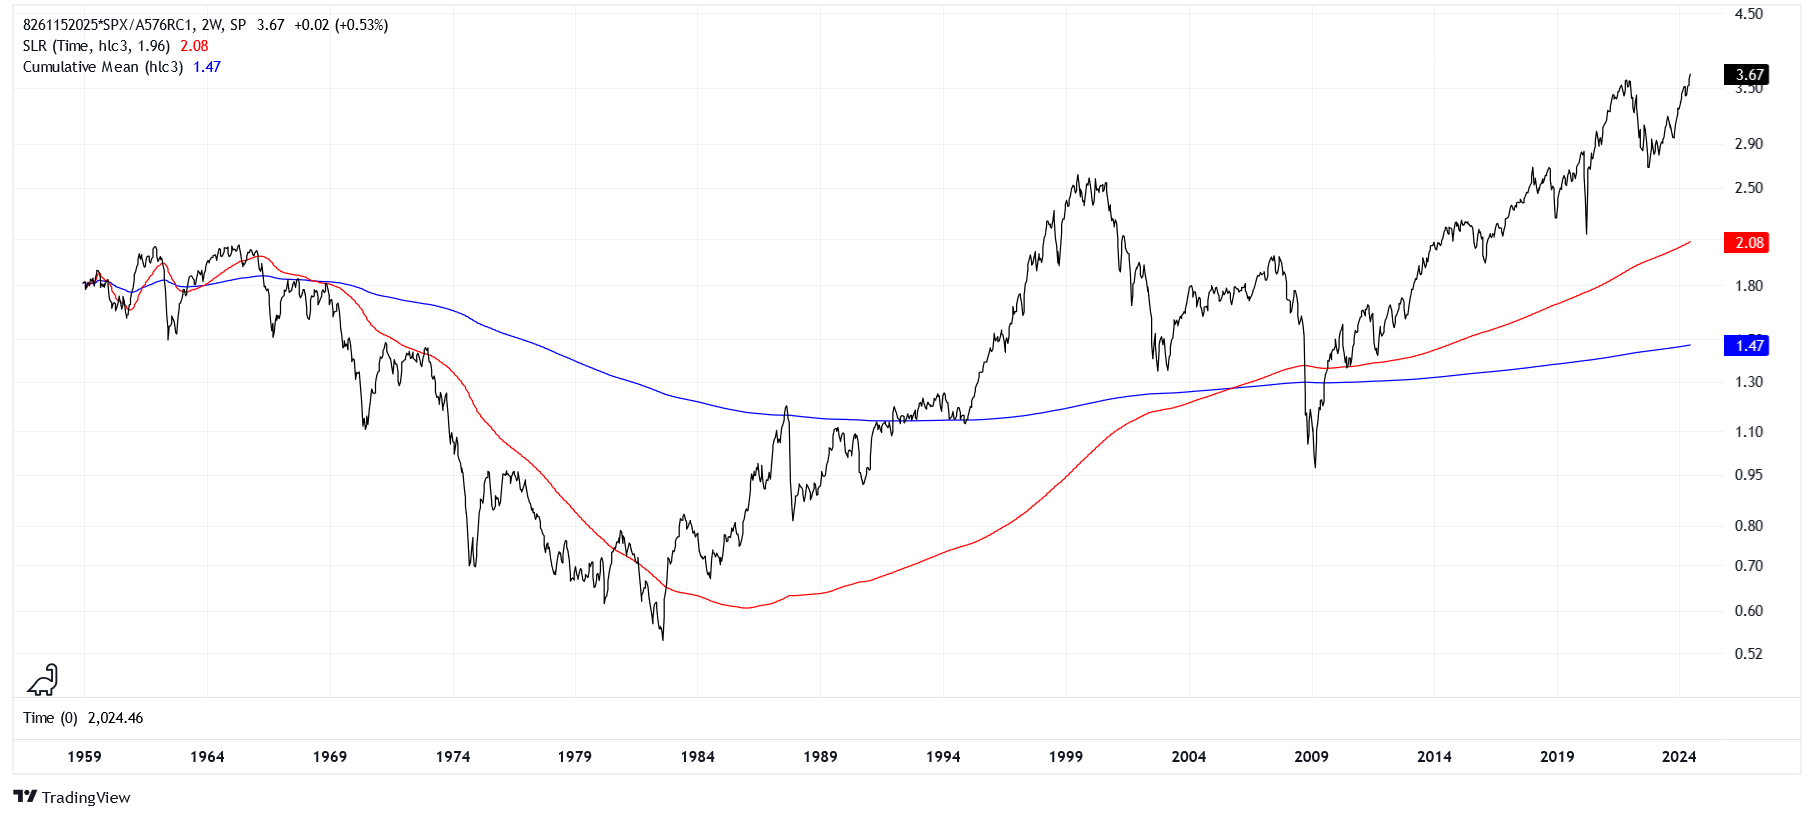
In the above chart, it is evident that the price of the market is extended relative to employee compensation. When relating the series to its cumulative mean and regression line, remember that the mean tracks what happened in the past and the regression is attempting to model the current trend.
Hopefully, you understand the routine by now. We pull up a spread between the SPX and some relevant series that we can price it against, add a couple trendlines for context, and go from there.
Let us run through a few more charts, my comments from here on will be limited.
Financial Assets
The total value of financial assets for U.S. households tries to account for the dollar amount of all the stocks, bonds, money market accounts, cash, credit, and more for non-businesses in America (non-profits are included alongside households).
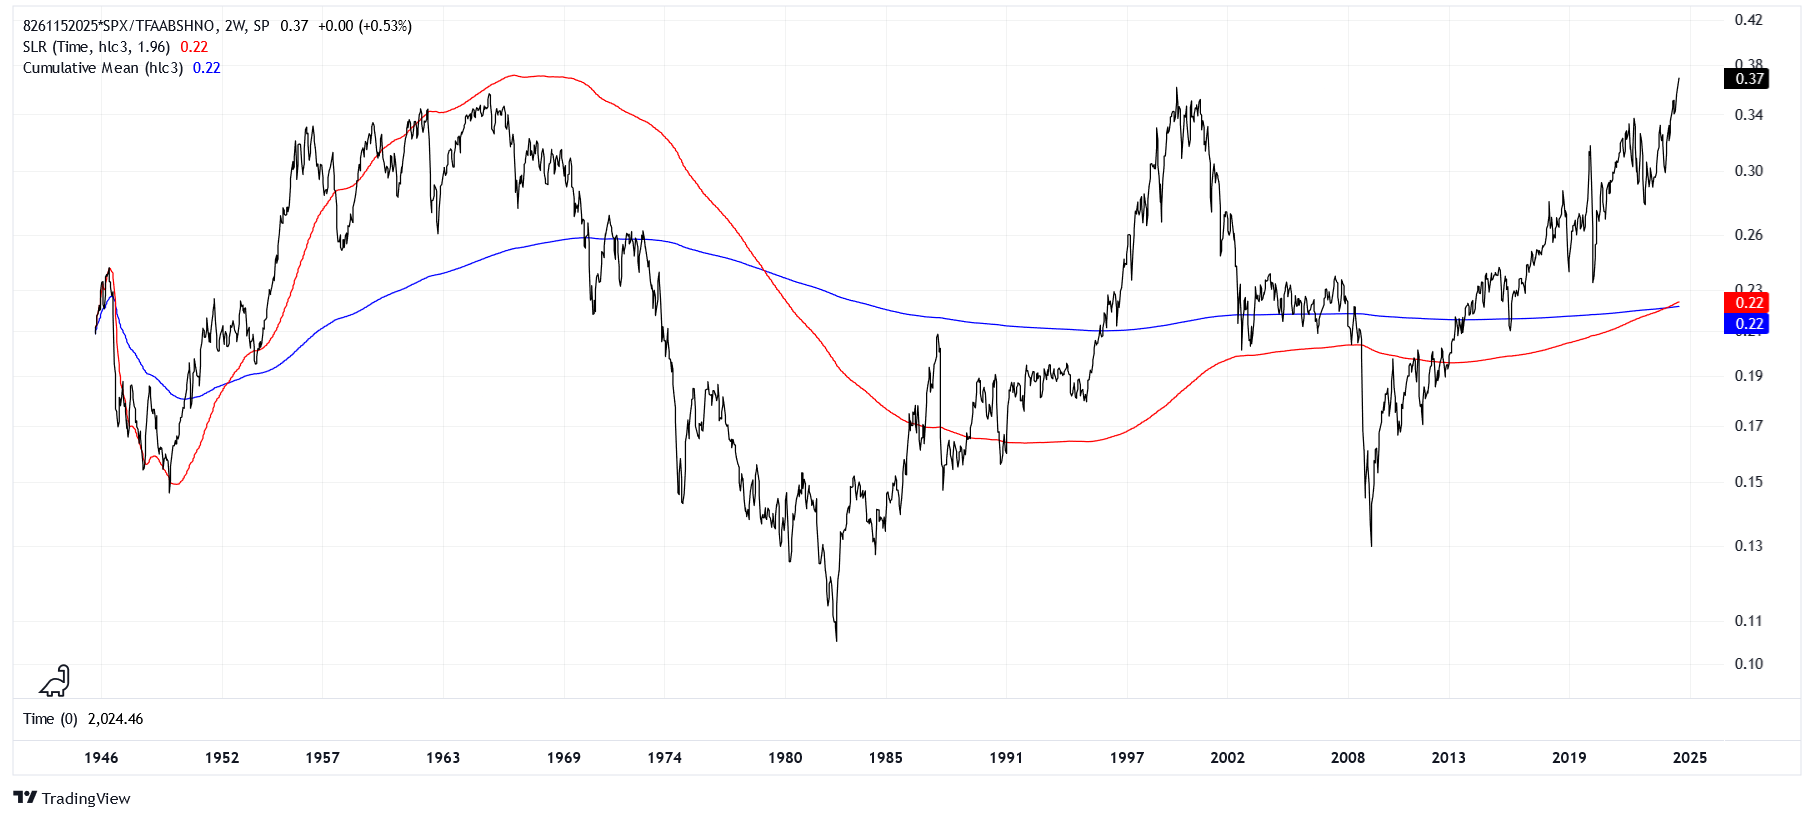
Currently, equities are making up a large portion of the overall financial assets, meaning there is more room to grow in alternative financial assets to stocks!
Consumer Loans
We have a series on the value of all consumer loans provided by commercial banks. This includes anything from long-term loans to short-term loans and credit cards. Basically, a loan is “future money” that is plucked out of thin air, only to be paid off down the road.
This “future money” can support financial activity, like buying stocks. Let’s see if there are enough loans to support the current price of the market.
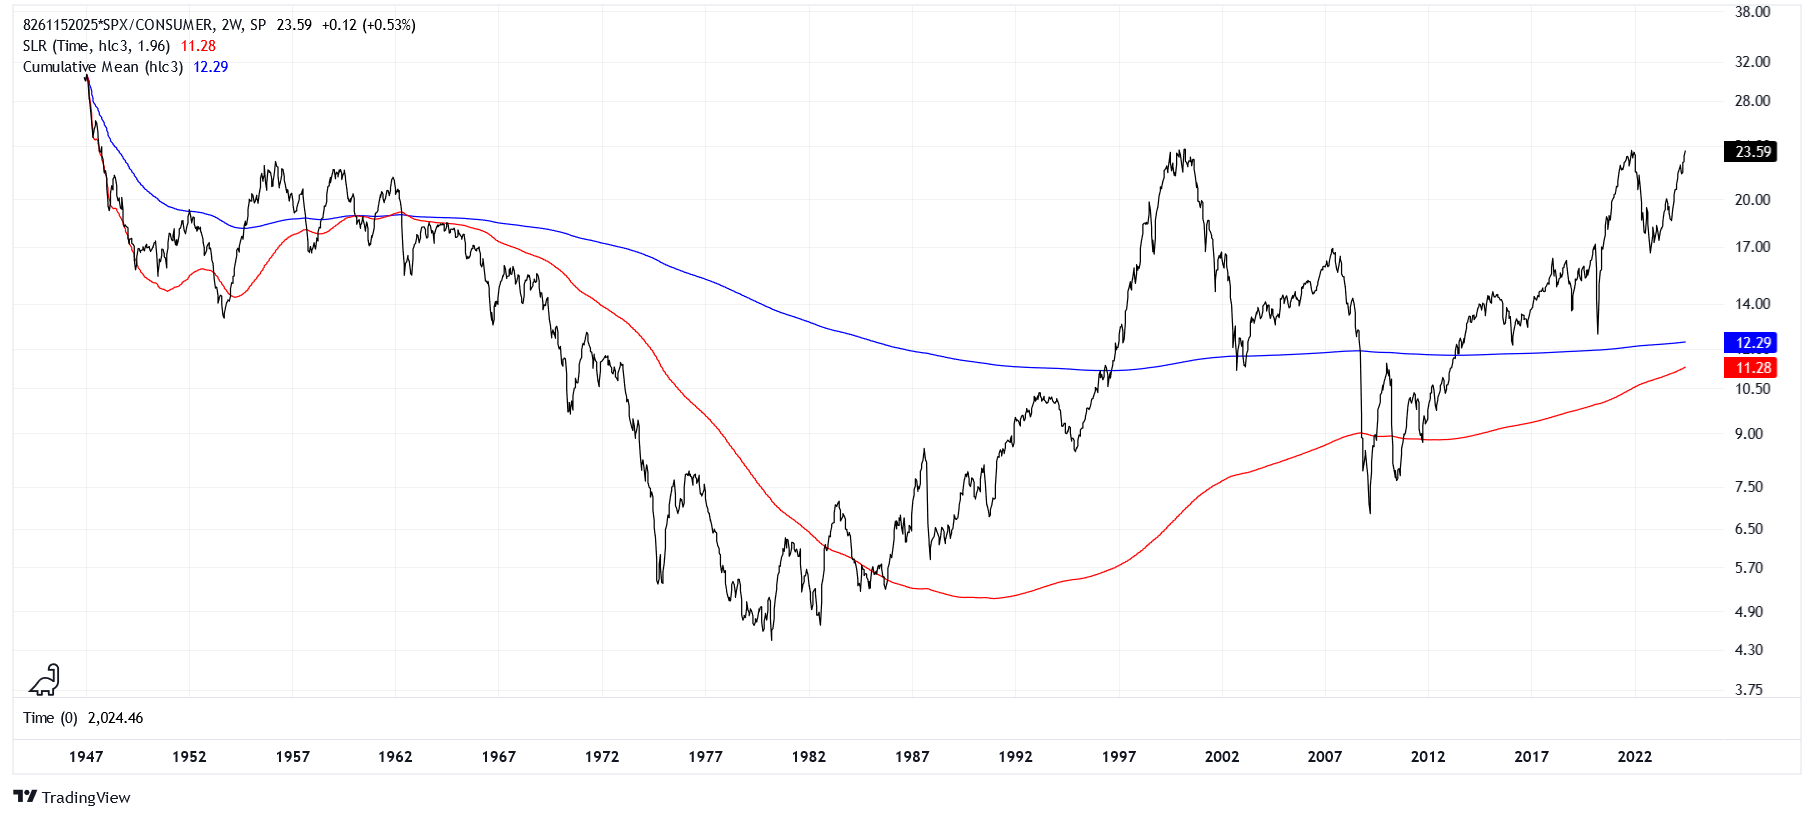
As much as people like to complain about their credit cards, Americans have been more diligent with credit following the Great Recession. Because of this, the value of stocks has soared above historical levels of loans being able to support them.
Money Supply
Many people have heard the phrase “M2” thrown around, but are never properly taught what it means. Put simply (because I am not going to teach you either) M2 is a measure of liquidity (short-term assets). Cash and short-term credit are the most common, but things like money market accounts, savings accounts, etc. are included depending on the M1, M2, M3, etc. level presented.
We will be using M3 for the U.S., which is broader than M2. The reason I don’t use M4 is because TradingView doesn’t carry it!
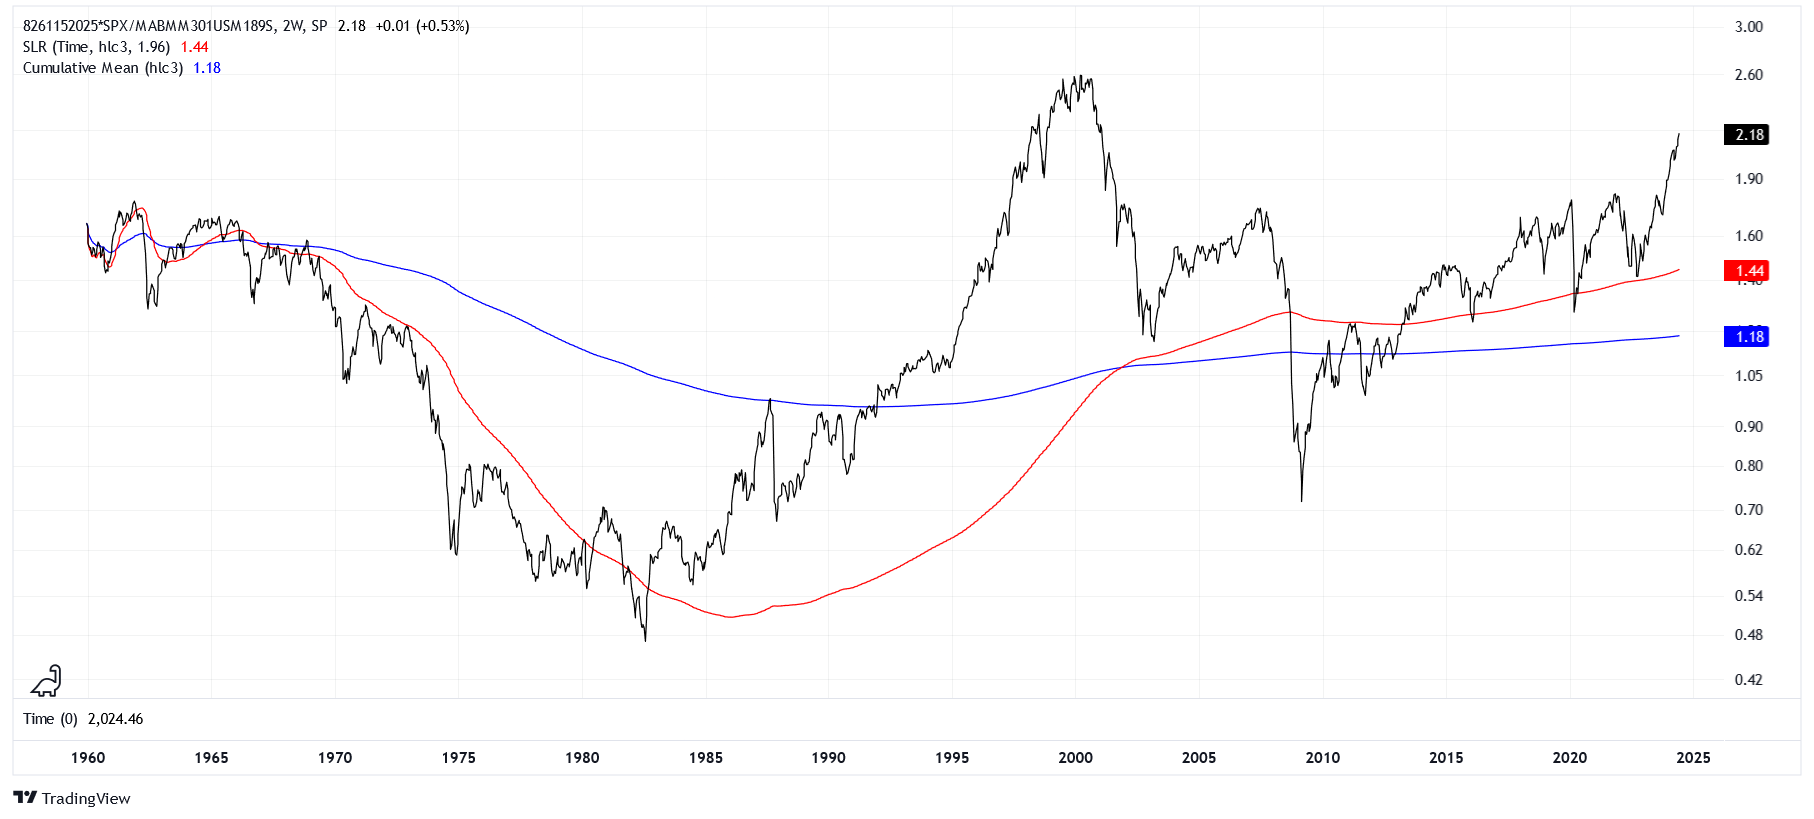
If you have heard of the “money printer go brrr” joke, then this chart above may surprise you. In fact, the money printer is not going brrr fast enough to keep up with the stock printer going brrr!
A Process, Not an Event
The “top” that is callable in markets isn’t really a top, it’s more of an inflection point.
I know, I know, the title of this article is false advertising… But I must be honest! Even at the resolution that technical analysis has some power, we are practicing something that is more of an art than a science.
That isn’t to say that market timing is all junk, it’s just that it’s more like a probability distribution than a decision tree.
What we can say is this: even if the market is able to eke out reward to the upside going forward, it will do so with growing volatility. The smooth performance of the market since October 2022 cannot continue forever.
I believe that sentiment and expense are both pointing towards a slowdown.