

Nevermind
Smells like Spirit Airlines.

In this week’s article, I own up to a few calls that didn’t go as planned.
Value Trap
When I was a child, I was fond of turning over rocks and playing with the bugs that crawled out. Now that I’m grown, I do the same thing with stocks, uncovering nasty-looking companies to see if they’re worth a closer look.
Then again, sometimes all you find are maggots.
Early is Wrong
Being right too early is indistinguishable from being wrong. If I know something’s going to happen in the market, but I’m five years too early, that’s the same thing as being wrong.
— Christopher Ailman
This idea hit home for me early in my investing journey, long before I started this blog. Back then, I was eager to dive into opportunities that seemed obvious—sometimes too obvious, and I learned the hard way.
One such moment came with my buying Netflix (NFLX) stock on April 20, 2022.
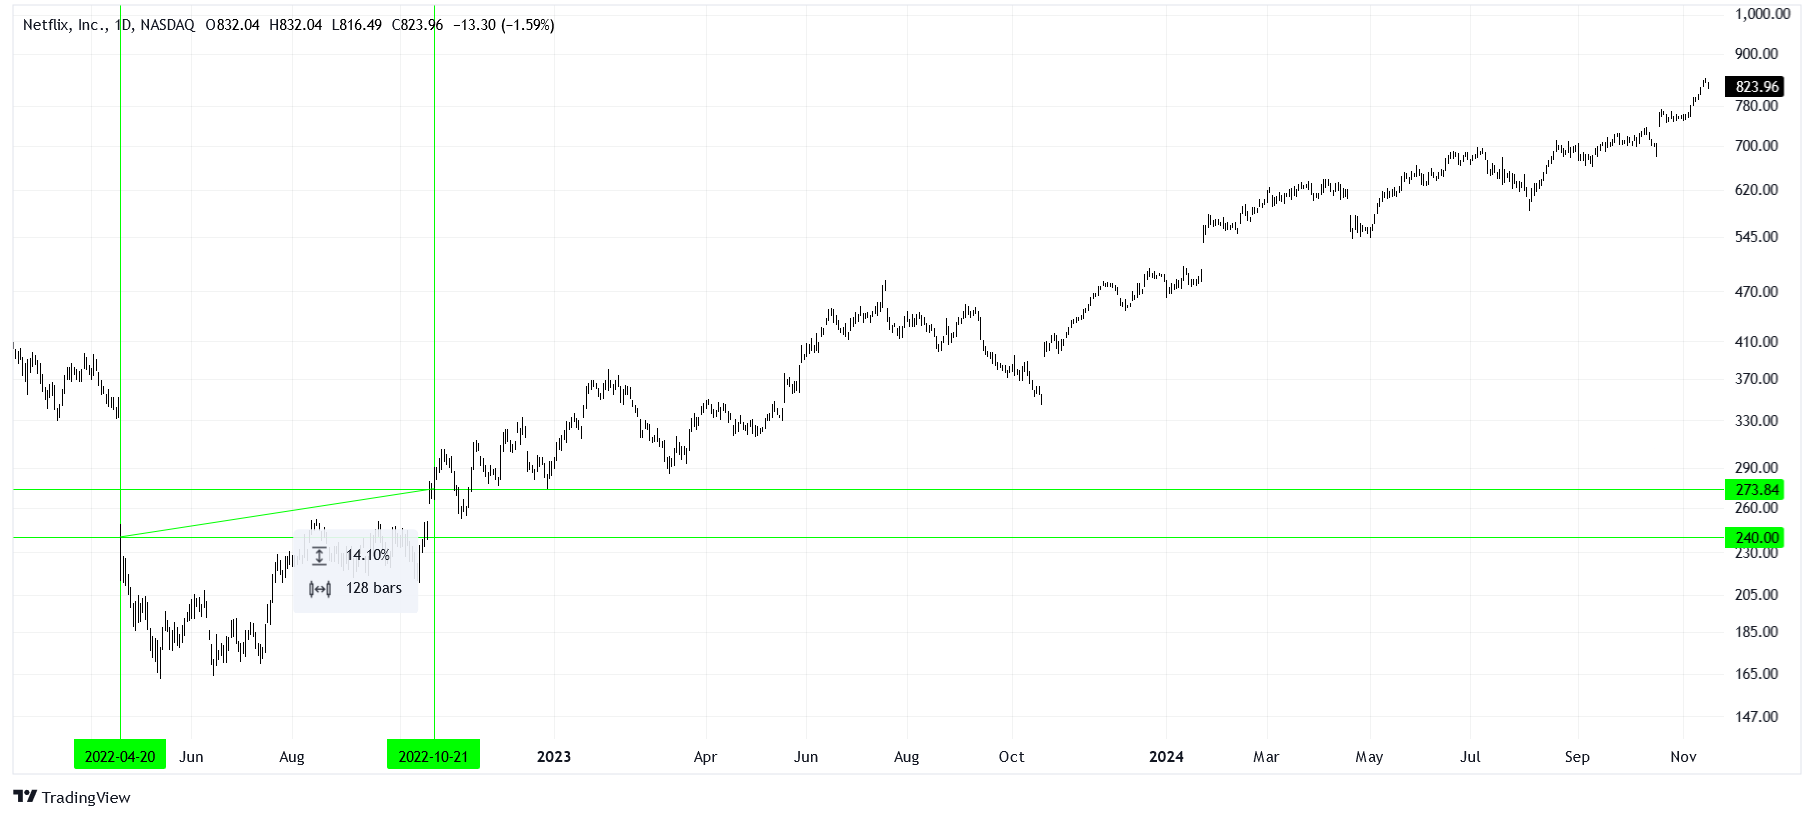
The day before the 20th, NFLX was tanking in after-hours trading, and I got excited. That night, I placed my limit orders, planning to “ladder-down” my long position by adding more shares as prices fell. When I woke up shortly after market open on the 20th, I was surprised to find that all my orders had filled—and I was now in the red, with an average share price of $240.
I had caught the falling knife.
My position stayed underwater for so long that, by October 2022, when it finally turned positive, I sold for a +14% gain. At the time, it felt like the right move. I was being risk-averse, and the price kept returning to the level where I’d sold.
Fast forward to today: NFLX is trading near $824, which would have been a +243% gain on the position. What caused me to trade this position so poorly? I entered too early, and the anxiety of unrealized losses clouded the more rational, patient parts of my mind. I forgot there was still a bullish case for holding the position.
I am learning to be more patient—not just to wait for a bottom to settle before entering, but also to let a position breathe and grow.
Wrong is Wrong
I wrote an article on this blog about Spirit Airlines (SAVE) on May 22 of this year. The stock was trading at $3.88 a share then. Today, it’s at $1.08, which would have been a -72% loss if you’d gone long based on my recommendation.

In my folly, I argued that if SAVE’s price-to-tangible-book (P/TB) ratio returned to 1.0, where it “should be” compared to the 0.42 it was trading at, a +117% gain was possible. At the time, this seemed like a reasonable assumption. To put it mildly, I’ve since learned a thing or two about balance sheet analysis.
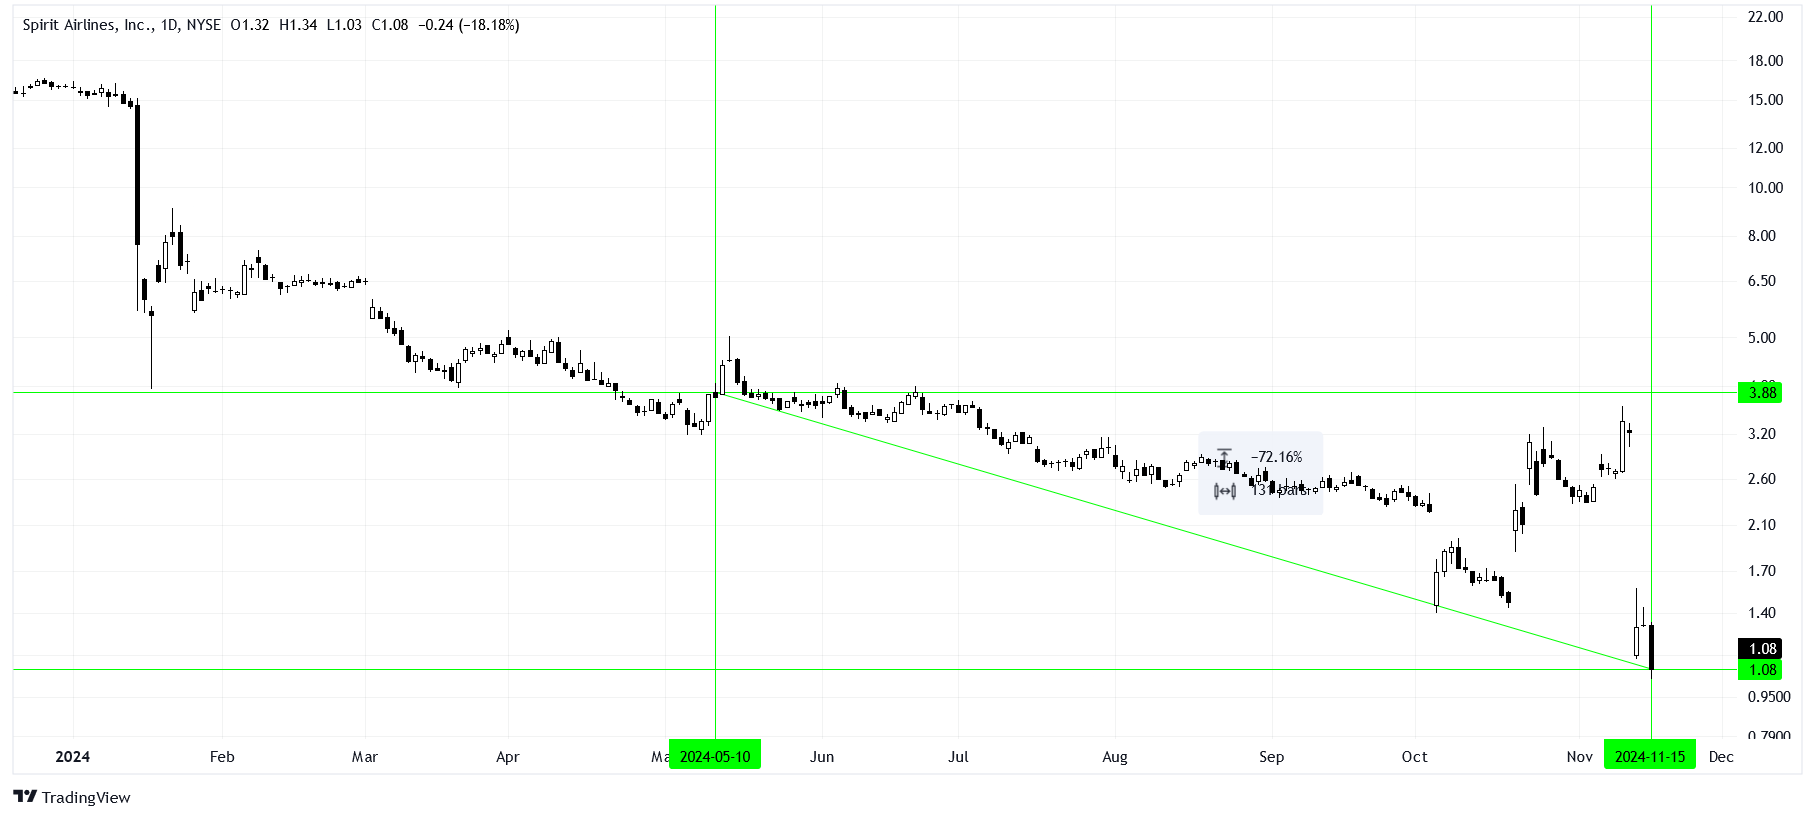
Initially, I had some hope for the recommendation. I was feeling smart, and that alone should have made me suspicious. Just two trading days after I wrote the article, the stock jumped as much as +30% from my recommendation at $3.88. But this seeming victory was short-lived, and by late July, it was clear that the price was losing support near that level.
If there’s any silver lining, I did highlight the risks of such a drastic drawdown. Unfortunately, those warnings were overshadowed by my overly bullish sentiment.
Learning Lessons
How has my analysis changed since May? Let me show you.
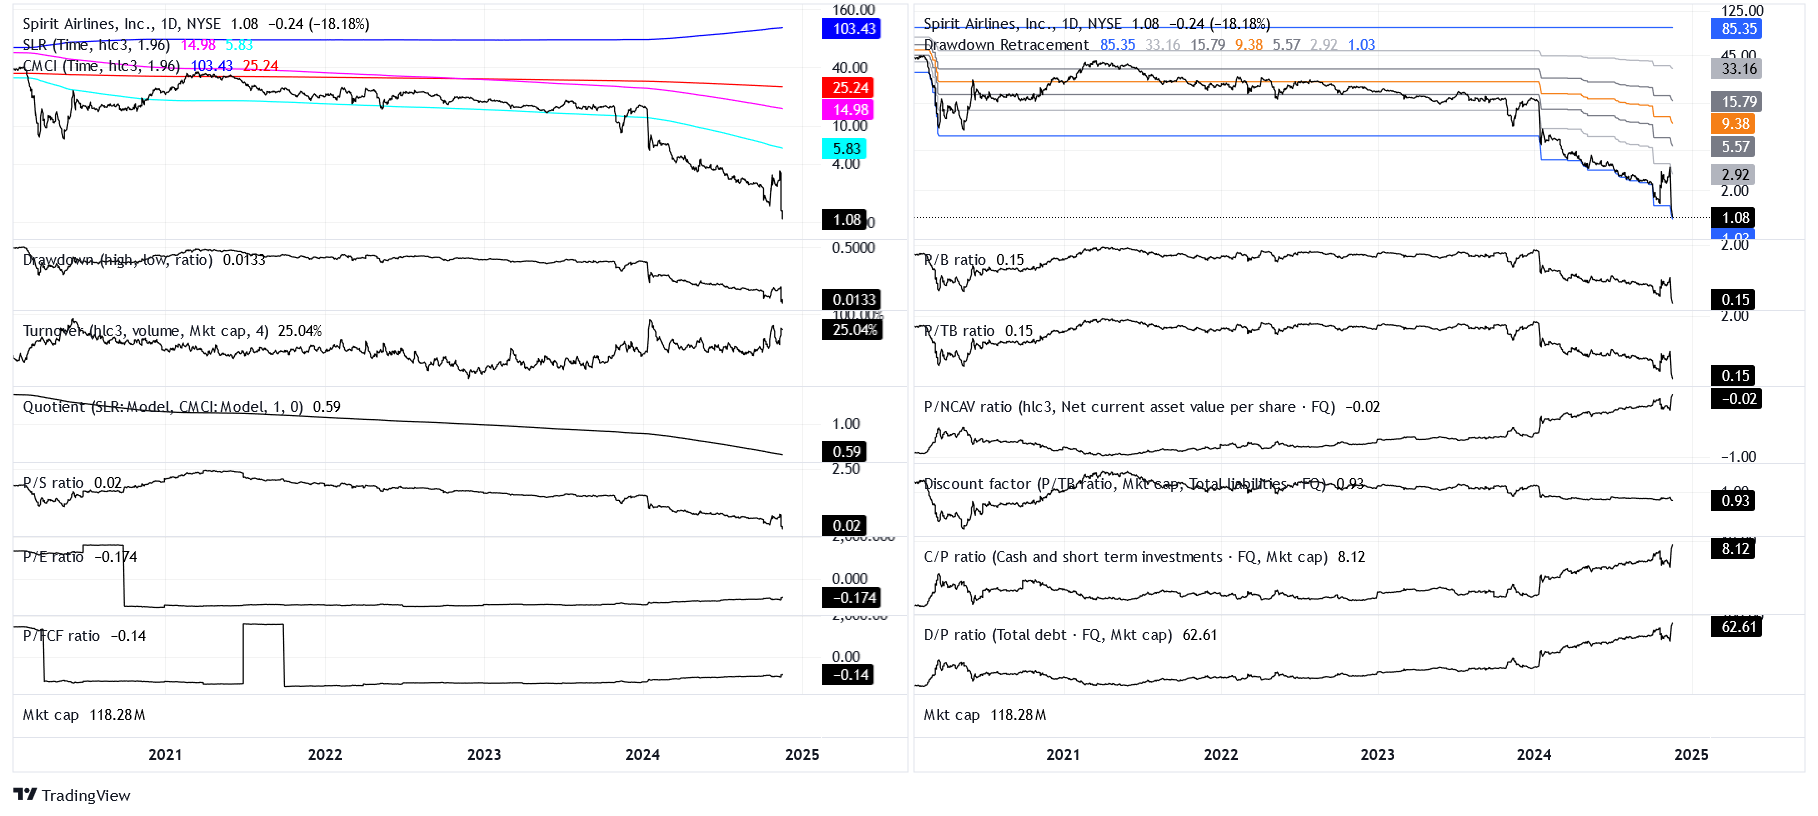
This is what I call my “value dashboard,” an eclectic mix of technical and fundamental indicators. It includes linear regression, cumulative averages, drawdown retracements, turnover, income-statement ratios, and balance-sheet ratios. It might look busy, but these indicators give me a holistic view of a stock’s prospects.
So why has SAVE been so toxic? How did it lose another -72% from a drawdown that was already -96% deep? What did I overlook back in May?
To start, consider the debt-to-market capitalization (D/P) ratio. This ratio makes it easy to say, “For every dollar you invest in SAVE, how much debt are you effectively buying?” In SAVE’s case, the answer is $62.61. That’s right—for every dollar you invest in SAVE, it’s like you’re buying $62.61 of their debt. I have yet to find another ratio in the market as extreme as this.
SAVE’s debt load is alarmingly high—so high, in fact, that I should have flagged it much earlier. Unfortunately, I missed it, and for that, I owe my readers an apology.
Still, how can their P/TB ratio be so low, at a mere 0.15? While this might suggest an undervalued opportunity, the discount factor gives a clearer picture of their financial health. Let’s calculate it, as we did last week with Chinese equities.

Given SAVE’s enterprise value and the value of its tangible assets, its discount factor is about 7%. That means there’s only a 7% margin of error between the book value of their assets and their real liquidation value. It’s a tiny cushion.
Compare that to SAVE’s discount factor in mid-2020, which was closer to 28%, and you can see that the opportunity to go long was far more attractive then than it is now.
I made a mistake—a big one—but I’m trying to learn from it. All I can do now is more thoroughly vet the stocks I showcase on this blog.
I’ll continue learning, improving, and sharing those lessons here.
If you can’t respect that, your whole perspective is wack
Maybe you’ll love me when I fade to black— Jay-Z, “December 4th”